Updated June 12, 2023

Introduction to T-test in R
The following article provides an outline for T-test in R. The T-test is used to measure the means of two groups to check they are equal to each other. Hypothesis testing is significantly used by data researchers to figure out their ideas. In some situation measuring or comparing a single item is not applicable practically, to solve this issue statistical methods were developed which tests hypothesis in the situation for comparison. One such most known hypothesis is T-test also referred to as student T-Test. T-test prefers data with a normal distribution in which data are distributed evenly.
How T-test is Performed in R?
The T-test in R is performed using t.test () function. It helps in comparing group means. It is performed by taking one or two sample T-tests on data. The normality check is done by several techniques based on the sample size. A visual analysis is done using a Q-Q plot and histograms.
Let’s take a scenario, working as a professor in Engineering college and wants to analyse the difference in computer ability of the male vs female. The aptitude test on computers is time-consuming so it is difficult in conducting for all the students. Therefore, randomly selecting a male and female candidate to examine. The T-test over here calculates the mean of two samples.
The T-test can be classified into One sample test, Independent two-sample test(Uncorrelated), Paired Test(correlated).
- One sample test: Condition to be checked is whether the given data are normally distributed. A particular formula will be given for a single mean.
- Independent two-sample test(Uncorrelated): This test considers two samples of data and the variance is equal or not.
- Paired Test(correlated): This test verifies the difference between the two-sample data are normally distributed.
The syntax is given below:
They have different arguments:
t.test (x, y)
Where x and y are data.
Examples of T-test in R
Here we can follow how to implement R in T-test.
Conditions:
- The data should be continuous.
- A random selection for observations.
- Checking whether the data is normally distributed.
Example #1
Implementing one – sample test.
In the case of this test, the t-test can be used to calculate the grade of a student. A level of significance is calculated for the null hypothesis. The value calculated is less than the assigned value then the null hypothesis is assigned i.e comparing with the critical value. We shall solidify with the below code with the data set. The CSV file used here is grade.csv.
Code:
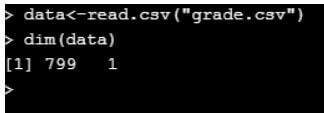
data<-read.csv("grade.csv")

dim(data)
Output:
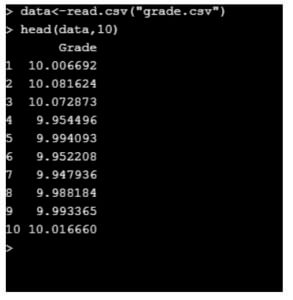
When considering the top 10 rows in the dataset.
Code:
data<-read.csv("grade.csv")

head(data,10)
Output:
Code:
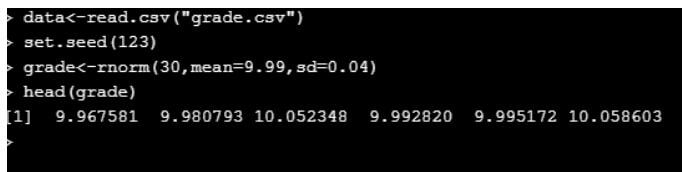
data<-read.csv("grade.csv")

set.seed(123)

grade<-rnorm(30,mean=9.99,sd=0.04)

head(grade)
Output:
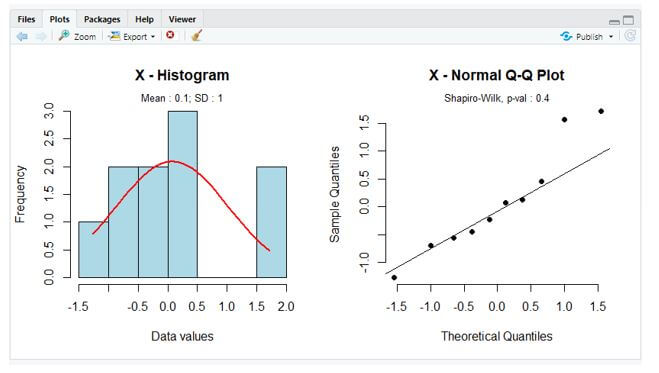
To compare the densities q-q(quantile) plots are used. Here its is plotted for a one sample.
Code:
qqnorm(data$Grade)

qqline(data$Grade,col="green")
The Q-plot is drawn below to show the Quantiles.
Output:
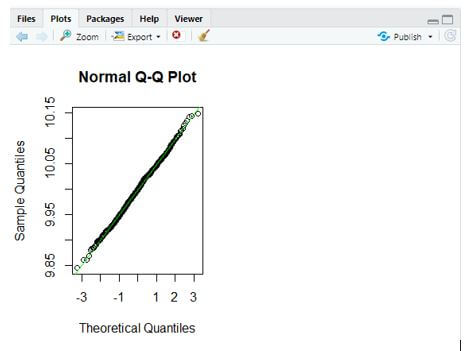
From the above plot, a straight line is drawn with a green colour and all the points lie on the same line.
Considering alternative hypothesis(takes less, greater as an argument)
Code:
data<-read.csv("grade.csv")

t.test(data$Grade, mu = 10, alternative = "less")
This statement can also be performed using rquery.t.test() function which gives the normal distribution values.
Output:
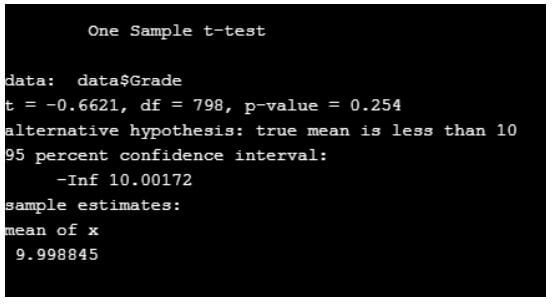
Here df denotes degree of freedom, t denotes statistics and the value is negative. The probability is less than 0.5.
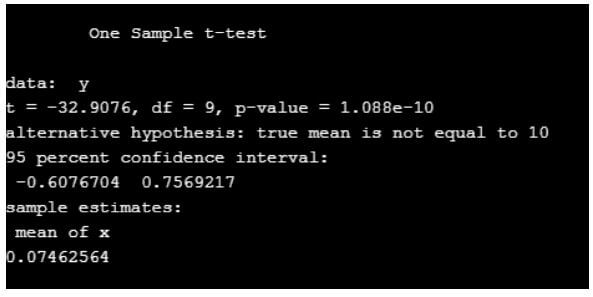
Code:
data<-read.csv("grade.csv")

set.seed(123)

y<-rnorm(10)

t.test(y,mu=10)
Output:
Example #2
Implementing two – sample test.
It is used to compare the means between two different sample data. Let’s assume that the average weight of male to the average weight of the female. To do so the number of male and female count should be the same. The CSV file used here is wt.csv.
Code:
data<-read.csv("wt.csv")

dim(data)
Output:
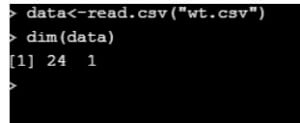
It has 1000 rows and 2 columns.
Code:
data<-read.csv("wt.csv")
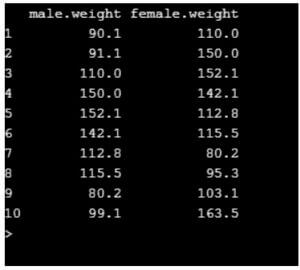
head(data,10)
Considering first ten rows.
Output:
Checking for homogeneity:
Code:
data<-read.csv("wt.csv")
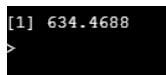
var(data$male)
Output:
Code:
data<-read.csv("wt.csv")

var(data$female)
Output:
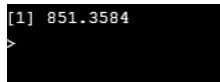
From the above checking the variance are equal.
Code:
data<-read.csv("wt.csv")
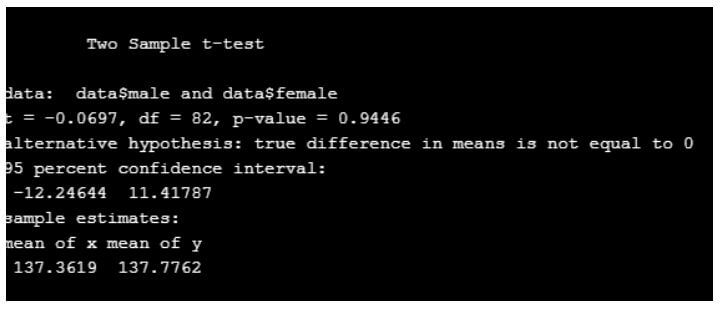
t.test(data$male,data$female,var.equal = T)
Output:
Code:
data<-read.csv("wt.csv")

t.test(data$male,data$female,var.equal = F)
Output:
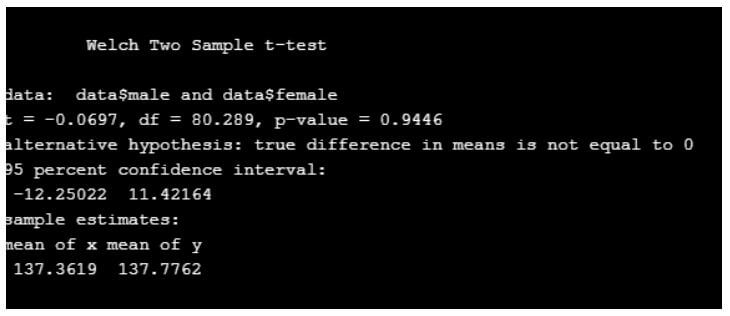
From the above code, there is no difference between the mean of two values.
Example #3
Implementing paired T-test.
Here variables come with paired categories. The T-test is applied to compare two variants.
A software company is willing to analyse the performance of their project on the market. They decided to monitor the sale on a weekly basis. Finally, the company is interested in knowing the difference between the before and after the process. Here the value comes from the same situation called market sale.
Code:
data<-read.csv("wt.csv")

fbef <- rnorm(6, mean = 40000, sd = 40)

fafter <- rnorm(8, mean = 40075, sd = 40)

t.test(fbef,fafter,var.equal = TRUE) #Even we can assign  paired=TRUE using rquery statement.
Output:
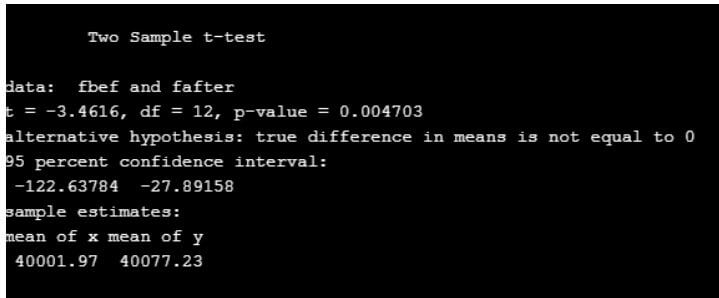
Here the p-value is less than 0.5, hence no difference in mean.
Advantages of T-test in R
- The T-Test is easy to understand and adaptable to all the scenarios (means flexible).
- T-test helps to determine the hypothesis testing in statistical methods. The significance of T-test in industries plays an importance role in quality checking of the products.
- The T-test can handle a sample size when n<30 to give the appropriate result.
- To generate many statistics values R uses replicate () function.
Conclusion
Therefore, we have implemented T-test with the null hypothesis, alternative hypothesis and simulation are performed in R studio. And also, we have learned different types of T-test with their simulation in R. R-test is widely used in statistical approach and in real-time applications. R-test is generally defined to find the difference of mean between two different groups.
Recommended Articles
This is a guide to T-test in R. Here we discuss the introduction to T-test in R, how it is performed in R along with advantages and respective programming examples. You may also have a look at the following articles to learn more –
