What is a Supply Curve?
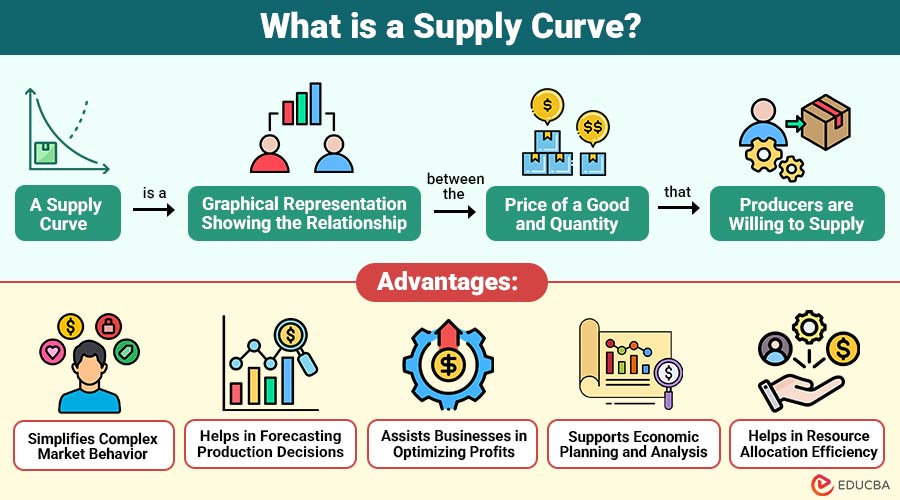
A supply curve is a graphical representation showing the relationship between the price of a good and quantity that producers are willing to supply. It believes that all other factors remain constant over a given period.
In simple terms, it illustrates how much of a product sellers are ready to offer at different price levels.
Table of Contents:
- Meaning
- Importance
- Key Characteristics
- Graphical Representation
- Types
- Factors Affecting the Supply Curve
- Real-World Example
- Advantages
- Limitations
- Difference
- Practical Use Cases
Key Takeaways:
- The supply curve shows a direct relationship between price and quantity of goods supplied by producers in markets.
- An upward slope reflects the law of supply, where higher prices encourage production and market output.
- Supply curve shifts due to changes in costs, technology, policies, expectations, and seller numbers.
- Businesses and governments use supply curve analysis for pricing, planning, forecasting, and resource allocation.
Importance of Supply Curve
Here are the key points that highlights the importance:
1. Helps in Price Determination
The supply curve, along with the demand curve, determines the market equilibrium price where quantity supplied equals quantity demanded.
2. Aids Business Decision-Making
In order to optimize profit, businesses examine the supply curve to establish the best pricing policies, production levels, and resource allocation.
3. Useful for Policy Formulation
Governments study supply patterns to design effective economic policies such as taxation, subsidies, and regulation to stabilize markets.
4. Market Analysis
Economists use to understand producer behavior, analyze market conditions, and accurately forecast future supply trends.
Key Characteristics of the Supply Curve
Below are the main characteristics that define how it behaves:
1. Upward Sloping Nature
It generally slopes upward from left to right. This suggests that there is a direct correlation between quantity supplied and price; producers are more inclined to supply more when prices rise.
2. Law of Supply
The curve is based on the law of supply, which states that higher prices lead to higher quantities supplied and lower prices lead to lower quantities supplied, all else being equal.
3. Ceteris Paribus Assumption
Relationship between price and quantity supplied is analyzed by keeping other factors—such as technology, input costs, and government policies—constant. This assumption is called ceteris paribus.
Graphical Representation of Supply Curve
Below is how it is represented graphically:
The supply curve is drawn on a graph with:
- Price on the vertical (Y-axis)
- Quantity supplied on the horizontal (X-axis)
A typical supply curve rises upward, showing that as prices increase, producers supply more goods.
Types of Supply Curves
Below are the main types based on different perspectives and time periods:
1. Individual
This curve represents the supply behavior of a single producer or firm. It shows how a business responds to price changes.
2. Market
The total of each market’s separate supply curves is the market supply curve. It shows the total amount provided by all producers at different pricing points.
3. Short-Run
In the short run, some factors (like machinery or factory size) are fixed. Producers can only adjust output to a limited extent.
4. Long-Run
In the long run, all factors of production are variable. Firms can expand capacity, adopt new technology, or enter/exit the market.
Factors Affecting the Supply Curve
Below are the key factors that influence shifts:
1. Cost of Production
When input costs fall, producers supply more goods; rising costs reduce production, thereby decreasing overall market supply levels.
2. Technology
Technological advancements enhance production efficiency, reduce costs, and increase output capacity, ultimately shifting output levels higher.
3. Government Policies
Subsidies encourage higher production and increase supply, whereas taxes and strict regulations discourage production, leading to decreased market supply levels.
4. Number of Sellers
An increase in producers entering the market raises total output available, expanding overall supply in the market.
5. Expectations of Future Prices
If producers expect higher future prices, they may withhold current supply, reducing present availability to sell more later profitably.
6. Natural Factors
Weather changes, seasonal patterns, and natural disasters directly affect production levels, especially in agriculture, leading to fluctuations in overall market supply.
Real-World Example of Supply Curve
Below is a practical example to understand how it works in real life:
Smartphone Industry
Consider a smartphone manufacturer:
- When the price of smartphones increases, the company produces more units to maximize profits.
- If production costs fall due to cheaper components, the supply curve shifts to the right.
- If the government imposes higher taxes on electronics, the supply curve shifts to the left.
This example highlights how both price and external factors influence supply decisions.
Advantages of the Supply Curve
Below are the advantages in economic analysis:
1. Simplifies Complex Market Behavior
Makes market activity easier to comprehend by graphically displaying the link between quantity provided and price.
2. Helps in Forecasting Production Decisions
Businesses use trends to predict future production levels based on expected price changes and market conditions.
3. Assists Businesses in Optimizing Profits
Firms analyze data to determine optimal output levels that maximize profit while balancing production costs effectively.
4. Supports Economic Planning and Analysis
Economists and policymakers rely on it to study markets, plan resources, and evaluate economic performance efficiently.
5. Helps in Resource Allocation Efficiency
Guides efficient distribution of scarce resources by showing how production responds to different price levels.
Limitations of the Supply Curve
Below are the key limitations in real-world applications:
1. Unrealistic Assumptions
The ceteris paribus assumption rarely holds in real-world markets where multiple factors change simultaneously.
2. Ignores External Influences
Does not fully account for global trade, political instability, technological shocks, or sudden changes in consumer behavior.
3. Not Always Upward Sloping
In certain markets, such as labor or rare goods, supply may not follow the typical upward-sloping pattern.
4. Static Analysis
It represents a single point in time and fails to capture continuous or dynamic changes in real market conditions.
5. Difficulty in Measuring Real Supply
Accurately measuring actual supply is challenging due to informal markets, unreported production, and data limitations in many economies.
6. Ignores Time Lags in Production
Does not fully consider delays between price changes and actual production adjustments in real-world industries.
Difference Between Supply Curve and Demand Curve
Here are the key differences between the both:
| Basis | Supply Curve | Demand Curve |
| Definition | Shows quantity producers are willing to supply at different prices | Shows quantity consumers are willing to buy at different prices |
| Relationship | Direct (Price ↑ → Supply ↑) | Inverse (Price ↑ → Demand ↓) |
| Slope | Upward | Downward |
| Perspective | Seller’s viewpoint | Buyer’s viewpoint |
Practical Use Cases
Here are some use cases across different sectors:
1. Business Planning
To optimize profits and make effective planning decisions, businesses use supply curves to determine optimal production levels, pricing strategies, and resource allocation.
2. Agriculture Sector
Farmers decide how much to produce based on expected prices to optimize yield and income during seasonal market fluctuations effectively.
3. Manufacturing Industry
Factories adjust output in response to cost changes and market demand to maintain efficiency, profitability, and competitive advantage.
4. International Trade
Countries analyze supply conditions to determine export and import strategies to balance trade, improve economic stability, and strengthen global competitiveness.
Final Thoughts
The supply curve is a cornerstone of economic analysis, offering valuable insights into how producers respond to market conditions. By understanding its structure, determinants, and applications, businesses and policymakers can make more informed decisions. While it has certain limitations, its practical relevance in explaining market behavior makes it an essential concept in economics.
Frequently Asked Questions (FAQs)
Q1. Why is the supply curve upward sloping?
Answer: Because higher prices motivate producers to increase production to earn more profits.
Q2. What causes a shift in supply curve?
Answer: Changes in factors like technology, costs, government policies, and the number of sellers.
Q3. What does a shift in the supply curve mean?
Answer: A shift in the supply curve means a change in supply caused by factors other than price, such as production costs, taxes, subsidies, or the number of sellers.
Recommended Articles
We hope that this EDUCBA information on “Supply Curve” was beneficial to you. You can view EDUCBA’s recommended articles for more information.

