Why Supply Chain Analytics is Key to Profitability?
In retail and manufacturing, small and mid-sized enterprises (SMEs) often operate on thin margins. Supply chain inefficiencies from unexpected stockouts to excess inventory can directly erode profits. Supply disruptions cost companies an average of 6–10% of annual revenue. The solution lies in supply chain analytics. By leveraging sales data, inventory metrics, supplier performance, and logistics information, SMEs can uncover hidden patterns and turn them into actionable insights that reduce costs and increase revenue.
Adopting analytics enables proactive decision-making rather than reactive firefighting. Companies moving toward a data-driven supply chain often see tangible benefits: higher service levels, leaner inventory, and stronger profit margins. An integrated, end-to-end strategy aligns every function, from demand planning through delivery, to maximize profitability and improve customer satisfaction. For SMEs, supply chain analytics acts as a leveler enabling smaller companies to punch above their weight through smarter forecasts, efficient logistics, and leaner stock levels. The result: lower operating costs, improved cash flow, and happier customers. Below, we outline a five-layer analytics model to help SMEs optimize their supply chains and unlock profits.
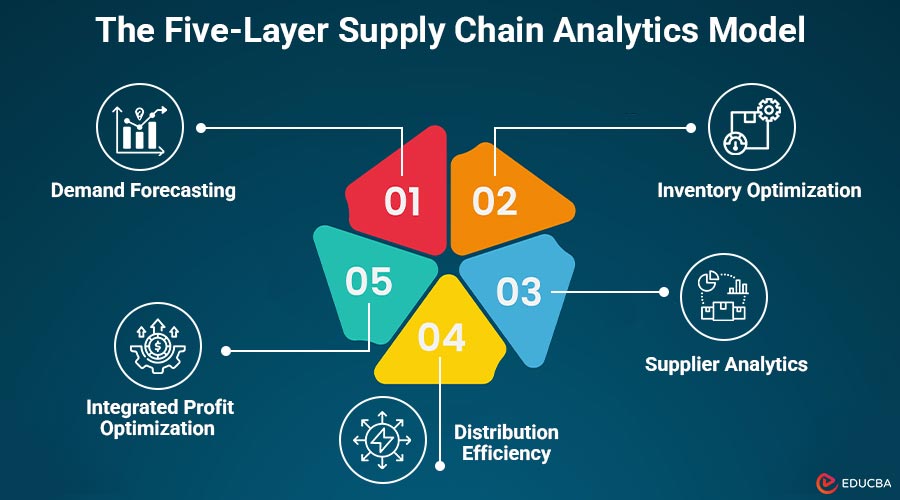
The Five-Layer Supply Chain Analytics Model
An integrated, analytics-driven supply chain uses a digital data core to connect forecasting, inventory, suppliers, distribution, and finance. Each layer feeds the next, creating a continuous feedback loop that drives smarter decisions and higher profitability. Below, we explore each of these five layers :
Layer 1: Demand Forecasting
The foundation of any data-driven supply chain is accurate demand forecasting. This layer predicts what customers will want, in what quantity, and when. By leveraging historical sales data, market trends, and external factors such as seasonality or economic conditions, supply chain analytics helps SMEs move from guesswork to precise predictions. Advanced forecasting uses time-series analysis and machine learning to uncover patterns that manual planning cannot detect.
Benefits include:
- Reduced stockouts and lost sales
- Prevention of overproduction and excess inventory
- Better alignment of purchasing, labor, and production plans
Example:
McKinsey research shows that improving forecast accuracy can increase revenue by 3–4% by reducing stockouts and lost sales.
In essence, this layer provides SMEs with a “steering wheel” to navigate demand fluctuations, thereby improving customer satisfaction and boosting profitability.
Layer 2: Inventory Optimization
With a solid demand forecast, the next layer is inventory optimization. This is the art and science of deciding how much stock to keep at any given time holding enough to meet demand and buffer against variability, but not so much that storage and obsolescence waste cash. Analytics-driven inventory management leverages sales rates, lead times, and holding costs to set optimal reorder points and safety stock for each product. The goal is a Goldilocks balance: not too much, not too little, but just right.
Inventory optimization is critical for profitability. Inventory is a major balance-sheet asset, with carrying costs like storage, insurance, and tied-up capital typically totaling 20–30% of its value annually. Reducing excess stock directly cuts these expenses, while avoiding stockouts protects revenue. Both overstock and stockout situations can quietly erode profit margins often simultaneously. Studies show that many organizations suffer a “double whammy”: lost sales from stockouts and capital tied up in excess inventory, reducing profitability by several percentage points.
Key Techniques:
- ABC analysis to prioritize high-impact items
- Demand variability analysis
- Simulation and optimization models
| Metric | World-Class Benchmark | Impact |
| Inventory Days (DOH) | 35–50 days (CPG) | Avoid idle stock, improve turnover |
| Inventory Turnover | 7–10 turns/year | Faster sales and free capital |
| Fill Rate (Service Level) | 97–99% | High customer satisfaction |
| On-Time Delivery (OTD) | ≥95% | Reliable delivery |
Optimizing these KPIs through analytics reduces costs and increases customer satisfaction. For example, world-class companies aim for a fill rate near 99% and OTD above 95%, ensuring customers get what they want, when they want it.
Layer 3: Supplier Analytics
Every product originates from a network of suppliers. The third analytics layer focuses on supplier selection and performance management. In traditional procurement, SMEs might choose vendors based on cost or familiarity.
A data-driven approach evaluates suppliers on multiple criteria:
- Cost competitiveness
- Quality defect rates
- On-time delivery performance
- Flexibility and risk factors
By analyzing historical supplier data and market benchmarks, companies can objectively score and rank suppliers.
Why does this matter for profitability?
Supplier choice directly affects the cost of goods, product quality, and supply chain reliability. The three key factors cost, quality, and delivery performance are optimized through analytics. For instance, a slightly cheaper supplier may not be ideal if they frequently deliver late or produce defective items, as these issues carry hidden costs in expediting or returns.
Ongoing supplier performance dashboards enable procurement and supply chain managers to monitor and collaboratively improve metrics. If a vendor’s on-time delivery drops below 90%, the system flags the issue so teams can take corrective action. Supplier analytics ensures continuity, cost efficiency, and reduced safety stock, turning procurement into a strategic function that secures value and reliability.
Layer 4: Distribution Efficiency
Even with excellent forecasting, optimized inventory, and reliable suppliers, profitability can suffer if the distribution network is inefficient. Distribution and logistics analytics focus on delivering products quickly and at the lowest possible cost.
This includes:
- Routing trucks efficiently
- Managing warehouse layouts
- Selecting distribution center locations
- Optimizing last-mile delivery
Analytics in this area uses route optimization algorithms, network modeling, and real-time transportation monitoring. Logistics software can plot the most efficient routes, reducing fuel costs and delivery times. It can also simulate “what-if” scenarios, such as opening a new warehouse or switching 3PL providers, to evaluate the impact on costs and service.
Business outcomes include:
- Cost savings: One large CPG company achieved an 8–12% reduction in transportation costs through route optimization.
- Improved customer experience: Quick, dependable deliveries strengthen customer loyalty.
- Better inventory responsiveness: Teams position products where demand is highest, reducing excess stock.
Technologies like IoT sensors and GPS tracking provide real-time shipment visibility and proactive adjustments, leading to fewer late shipments, lower freight costs, and happier customers all boosting profit margins.
Layer 5: Integrated Profit Optimization
The final layer integrates insights from all previous layers to maximize financial performance. This is where teams evaluate demand, supply, and delivery plans as a unified strategy to achieve profit, cash flow, and customer satisfaction goals.
Analytics tools perform:
- What-if analysis
- Scenario planning
- Financial modeling
For example, how would a 10% increase in demand for Product A impact procurement, production, distribution, and profit? Should a higher-cost supplier be chosen if it allows faster delivery and higher sales? Integrated analytics answers these multidimensional questions. In practice, this layer aligns Sales & Operations Planning (S&OP) or Integrated Business Planning (IBP). Cross-functional teams sales, operations, finance review shared data and make coordinated decisions.
Benefits include:
- Reduced excess inventory costs
- Higher profit margins
- Improved customer satisfaction
Advanced algorithms, such as linear programming or AI-based prescriptive analytics, can determine the optimal product mix, dynamic pricing, and promotion strategies to maximize contribution margin. Essentially, this layer ensures that improvements from layers 1–4 translate into better profit-and-loss outcomes.
This multi-layer approach is inspired by AI techniques used in financial forecasting. Just like AI combines different models to get more accurate results, stacking analytics layers in supply chains makes sure each layer supports the next, improving overall profits and strength.
Business Benefits of Supply Chain Analytics
When SMEs implement this five-layer analytics model, the improvements do not just show up in reports they translate into real business outcomes that owners and managers will appreciate. Here are some of the key benefits and performance gains companies can expect:
1. Higher Inventory Turnover
Analytics helps maintain learner stock levels without sacrificing sales. Products flow faster through the system, freeing up working capital and lowering storage costs. In a data-optimized operation, inventory is no longer money stuck on shelves but a responsive asset. This efficiency directly improves cash flow and reduces waste in the supply chain.
2. Wider Profit Margins
Each layer of analytics trims fat and plugs revenue leaks together boosting the bottom line. Better forecasts mean more sales captured; optimized inventory means less capital drain; efficient routing means lower logistics spend. When all departments align supply with demand, companies reduce excess costs and increase profit margins while still meeting customer needs. In short, more of each dollar of revenue turns into profit.
3. Improved Customer Satisfaction
Ultimately, an analytic supply chain is a customer-centric supply chain. Fewer stockouts and faster deliveries lead to happy customers who get what they want, when and where they want it. For instance, companies that optimize distribution can offer faster delivery and more reliable service, thereby enhancing customer satisfaction and driving repeat business. Satisfied customers translate into loyalty, positive reviews, and revenue growth.
4. Greater Agility and Resilience
An often-overlooked benefit of data-driven decision-making is the ability to adapt quickly. Real-time analytics enable SMEs to quickly identify and respond to shifts in demand, supply disruptions, and delivery delays. This resilience means less firefighting and more consistency. During unforeseen events from a sudden spike in demand to a supply disruption companies with robust analytics can adjust course in hours or days, not weeks, mitigating losses and sometimes even turning challenges into opportunities.
5. Data-Driven Culture and Confidence
Adopting supply chain analytics also instills a culture of data-driven decision-making across the organization. Managers start asking “what does the data say?” for every key decision. This builds confidence in strategies and plans, as they are backed by evidence. It can also help teams work better together when everyone trusts the data, so sales, operations, and finance run more smoothly with the same information. The added benefit is a smarter company that keeps learning and getting better.
Final Thoughts
SMEs can no longer depend on guesswork or old methods to manage their supply chains. Supply chain analytics provides a clear way to increase profits, improve cash flow, and make customers happier. Begin by spotting the main problems stock shortages, too much inventory, unreliable suppliers, or late deliveries and fix them step by step using analytics. Even small improvements across the five layers can add up to a big financial benefit.
By thinking in a data-driven way, using analytics tools, and encouraging decisions based on facts, SMEs can achieve quick wins and grow steadily over time. Treat your supply chain as the engine of your business, and let supply chain analytics power it to improve performance, profits, and growth.
Author Bio: Ankush Sanjay Mahajan

Ankush Sanjay Mahajan is a Senior Technology Project Manager and Business Systems Analyst with over 10 years of experience in enterprise systems, financial analytics, econometrics, and AI-driven decision frameworks. Based in California, USA, he delivers high-impact solutions across energy, finance, healthcare, logistics, and compliance systems, combining business transformation with data science expertise.
Recommended Articles
We hope this guide on supply chain analytics helps you unlock smarter supply chain decisions. Explore these articles for deeper insights and practical strategies to drive business growth.
