Updated March 24, 2023
Introduction to Statistical Analysis Regression
Statistical Analysis Regression uses the statistics methods such as mean, median, normal distributions to figure out the relationships between the dependent and independent variables, to access the relationship strength between the variables and for modelling the new relationship among them, as it involves various variations such as simple linear, multilinear and non-linear where the non-linear regression is mainly used for complicated datasets in which the independent and dependent variables shows the nonlinear relationship.
Mean: Mean or statistical mean is derived from adding all the numbers and then divide by how many numbers are there.
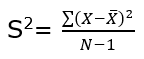
Standard deviation: Standard deviation is a measure used to quantify the amount of variation in a set of data.
Standard deviation = Squared root of variance i.e., S
Variance = Squared of Standard deviation i.e., S2
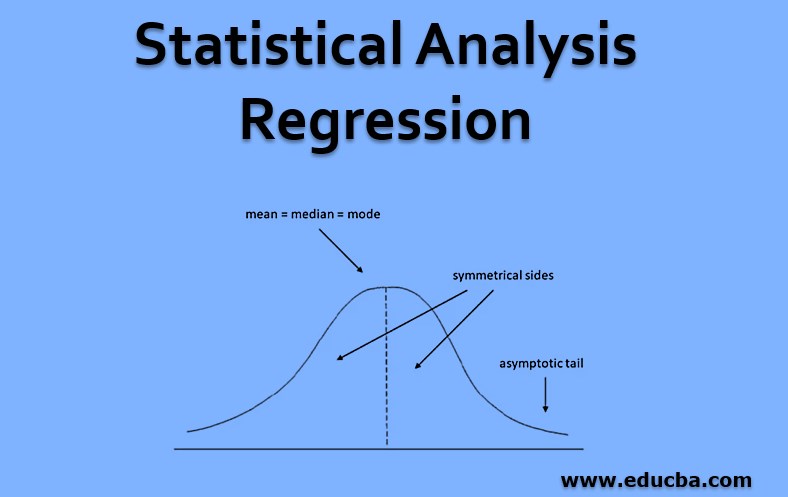
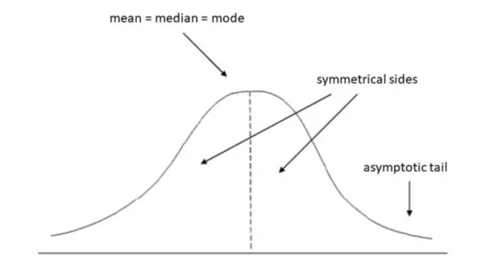
Normal distribution: For regression analysis, we follow the normal distribution. It is a probability distribution. In normal distribution mean is equal to median which is equal to mode (mean = median = mode). It is also called bell-curved distribution.
Regression in statistics is the relationship between the mean value of one variable i.e., output and its related values of other variables i.e., time and cost.
Regression analysis will help in providing an equation for a graph so that predictions can be made for the data.
Examples:
- We can use regression analysis in marketing to determine the best groups that should be targeted in the marketing campaign.
- The simplest example of regression analysis is – when there is a connection between how much you eat and how much you weigh; regression analysis can help you quantify the same.
So, from the above example, we understand that regression analysis in statistics is a set of statistical processes for estimating the relationships between a dependent variable and one or more independent variables.
In simple words, regression is the best guess at using a set of data to make a prediction.
Need for Statistical Analysis Regression
We know that the correlation coefficient is also a statistical relationship between two variables and it only gives us the degree of relationship or association. It cannot help us in predicting or estimating the response variable for a given independent variable. Here the response variable is also known as the dependent variable.
We need statistical analysis regression for the below reasons: –
- To explain the variations in the dependent variable as a result of using a number of independent variables.
Example: When we examine the factors that influence profit volume in a company. Here profit volume is considered as a dependent variable because it may be affected by other variables.
- To describe the nature of a relationship in a precise manner by way of the statistical equation.
- To use the prediction and forecasting problems.
- To help in removing an unwanted factor.
- For identifying potential relationships between business variables and address any possible outcomes or solutions between them.
Decision-makers of a company can use regression analysis results for making important decisions that add significant business values to the growth of the company.
How to Perform Statistical Analysis Regression?
Regression analysis is used to predict future results by analyzing the present and past data.
Case study:
The below example shows us a basic understanding of how regression analysis is performed
Let us perform a regression analysis of sales volume for a doll manufacturing company.
Consider the below
Sales Volume for the manufacturing company (Target) = Y
Here Predictors are:
- Price = X1
- Doll A model = X2
- Year = X3
- Other Aspects = X4
Consider the level of impact of each predictor or variable equal to b. The level of X1 impact is b1, X2 it is b2 and so on. Now we have the coefficients – b1,b2,b3..bn
Here the value of Y can be affected by one or more combinations of all independent variables.
We can use simple linear regression formula for sale volume:
Y = b1X1 + b2X2 + b3X3 + ….. + bnXn
By this, we can understand that regression analysis uses observations data to estimate the values of the coefficient of b1,b2,b3,.., bn. Post this we can predict sale volume (Y) using the below formula. Here sale volume is estimated so we call it Ŷ.
![]()
Please note that Y ≠ as Ŷ and Ŷ is just an estimated value.
So to correct the value of Y we do the below
Y = Ŷ ± error
In other words, y equal to y had a plus-minus error.
What if we understood that in our regression model there is no impact of X1, X2, X3, and X4 on Ŷ
In another way, the values of b1,b2,b3, and b4 are equal to zero then sales volume is equal to 0
Below will be the formula:
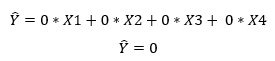
Therefore Sales volume = Zero which is incorrect. Sales Volume cannot be 0.
In this situation, we fix it by adding other coefficient b0. Here b0 is called intercept or constant.
Then below will be the formula
![]()
This is called Multi Linear Regression.
Here:
- is called intercept or constant
- b1,b2,b3,b4 are called coefficients
Regression Scatterplot graph in Excel
Lets us learn how to plot graphs in excel with the below problem statement.
Problem Statement:
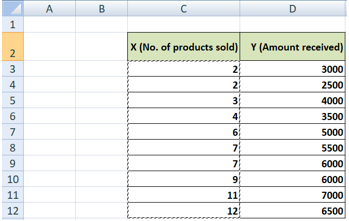
| X (No. of products sold) | Y (Amount received) |
| 2 | 3000 |
| 2 | 2500 |
| 3 | 4000 |
| 4 | 3500 |
| 6 | 5000 |
| 7 | 5500 |
| 7 | 6000 |
| 9 | 6000 |
| 11 | 7000 |
| 12 | 6500 |
We have two columns in the above table X and Y.
X is the number of products sold and Y is the amount received after selling the products.
So in this problem, the first-row state’s number of products sold is 2 and the amount received after selling the product is ₹3000.
The second row states that the number of products sold is 2 and the amount received after selling the product is ₹2500 and so on.
We can now run simple descriptive statistics on this data.
We need to be sure that we have data analysis available in excel.
And if you don’t have this you’ll simply need to:
- Go to file then click on excel options.
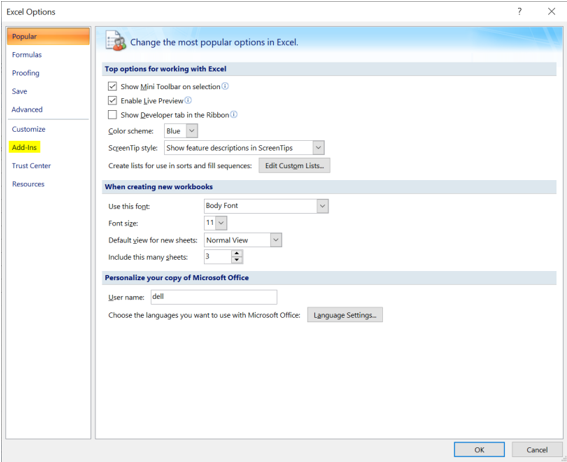
- Select Add-ins and press OK.
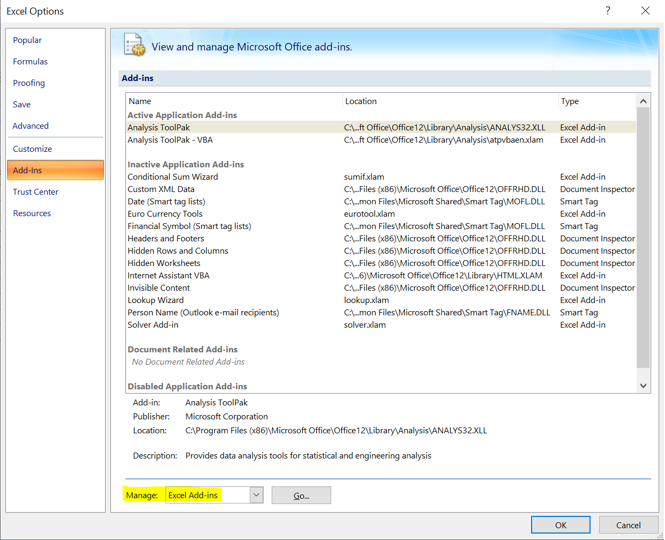
- Then click on add-ins under Manage select Excel Add-ins and click on GO.
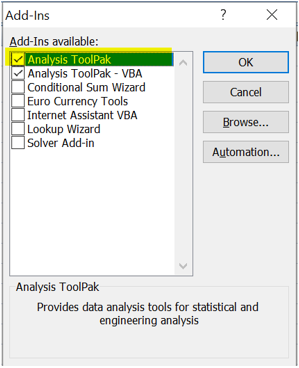
- Then click on go and be sure that you select Analysis ToolPak.
- You will then get the option of data analysis in the toolbar.

Now that we have data analysis options in excel lets run descriptive statistics.
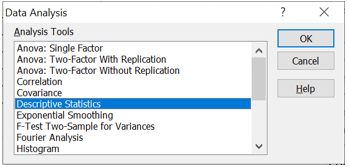
- Click on the data analysis option and select Descriptive Statistics and then OK.
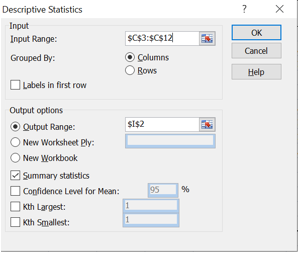
- Select the input range as complete X i.e., the number of products sold in the below case from C3 to C12. Select Summary Statistics. If you want you can select the output range in this sheet (it’s optional), then click OK.
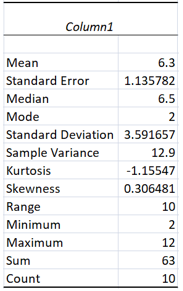
- We will get the result in Column 1, where we get all the central tendency and other details.
Plotting Regression Analysis in Excel
- Select the complete excel of X & Y. Go to insert < select scatter < choose first option.
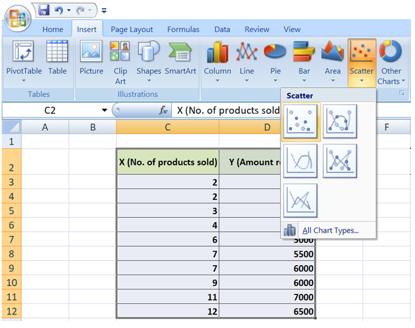
- The below chart pop-ups.
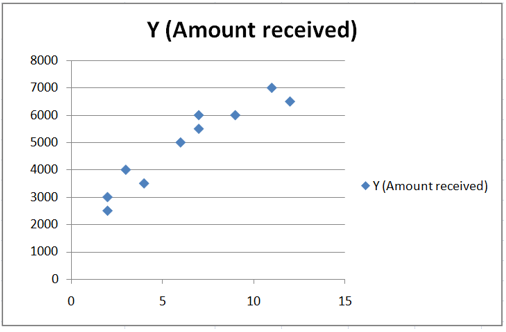
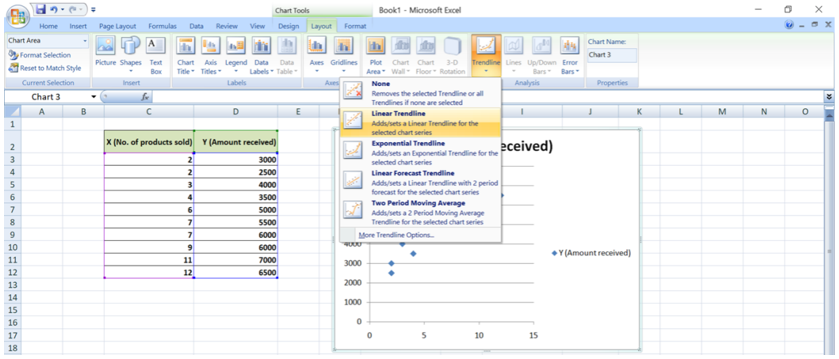
- Click on chart < go to layout and select Trendline. Choose Linear Trendline.
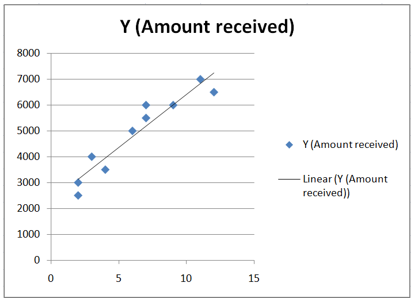
- We can now find the trendline below.
Advantages of Statistical Analysis Regression
Now that we know how statistical analysis regression is performed, we need to understand the advantages after performing the regression analysis.
Below are a few advantages of statistical analysis regression:
- Predictive analytics: Regression analysis results can define the business outputs. It helps to predict sales in the near and long term.
- Business Operation efficiency: For a small business, it determines which factor matters the most and which factor can be ignored. It can be used to understand inventory levels, supply and demand levels.
Conclusion
We can now understand that Regression analysis is a family of statistical tools that can help business analysts build models to predict trends, make tradeoff decisions, and model the real world for decision-making support. Regression analysis helps to make better decisions for the business currently and for the future. Regression forecasting is used to determine the relationship between variables. Data provides fresh and new insights into the business which can help find the relationship between different variables to uncover patterns.
Recommended Articles
This is a guide to Statistical Analysis Regression. Here we discuss the needs, advantages of Statistical analysis regression and how to perform it. You can also go through our other suggested articles to learn more –

