Updated March 14, 2023

Introduction to SQL Crosstab
Crosstab is the situation where we require that the results of the table or query are rotated in the sense that would lead to the data that is present in columns to be displayed in a horizontal manner and the data which is present in the rows of the table to be represented in the vertical format. This rotation of the data representation is called the crosstab or a pivot table. There are many ways using which we can display the data in the crosstab format in SQL. In this article, we will see how we can transpose the data that rotate the data to display in crosstab format using a simple case statement and then by using the pivot statement in SQL with the help of some examples.
Crosstab Format
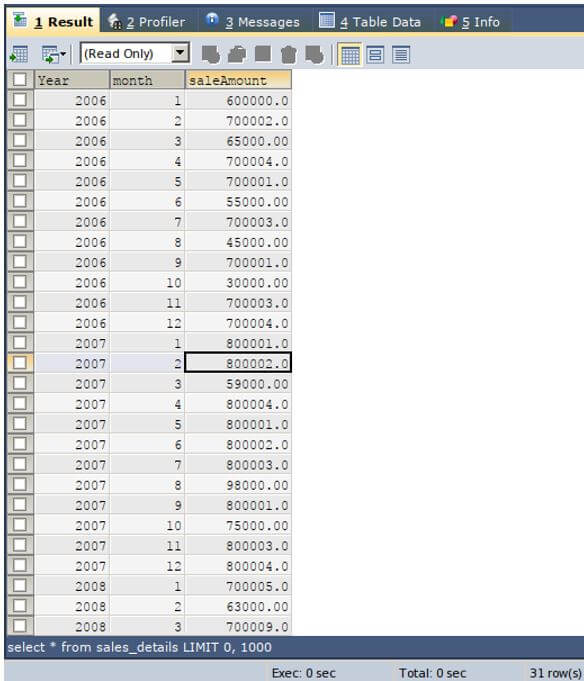
To see the format let us consider one simple example, where we have on existing tables named sales_details in the database named educba, which stores the monthly sale amount of each month beginning from the year 2006 and has columns maintained in the table which includes the year, month and sale of that month.
The contents of the tables are as shown in the output of the below query statement.
Code:
SELECT * FROM sales_details;The execution of the above query statement gives an output which is as shown below, where we have data up to the 7th month of 2008, and the table contains a total of 31 records in it.
Output:
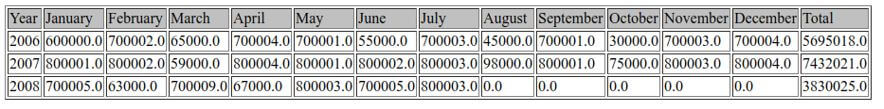
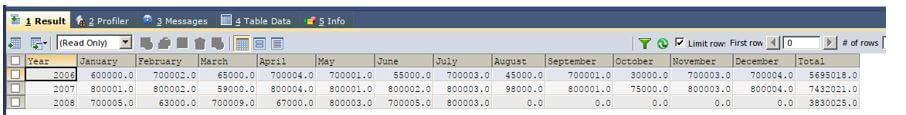
Now, what we have to do is calculate the total sale amount of each year and display the month values and sale amount values in the horizontal manner such that the year and their respective month details are shown further after the year column, and the last column should include the total column that will show the yearly total sales as shown in the below format.
Now, we will see how we can display the data in the crosstab format as shown above by both of the ways that include the use of the case statement and secondly the use of the pivot statement.
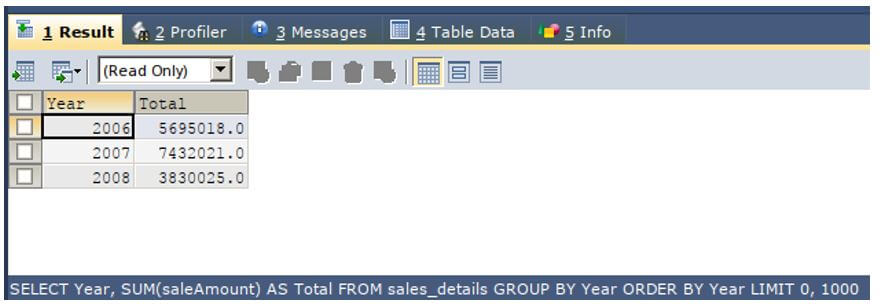
Let us first calculate each year’s total and display all the year values that are present in the table. For this, we will make the use of a simple query that will group the result based on the year and order the result set on year column value and use the sum aggregate function to calculate the total sale of each year.
Code:
SELECT YEAR,
SUM(saleAmount) AS Total
FROM sales_details
GROUP BY YEAR
ORDER BY YEAR;
Output:
Standard ANSI-SQL Crosstab
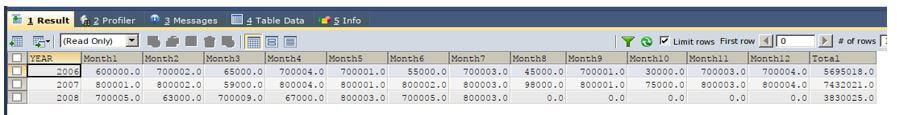
The standard SQL supports the usage of case statements that can be used to revert the row values to column values and vice versa. Now, let us try implementing the cross tab functionality to achieve the resultset, as shown in the above figure.
Our query statement will be as follows, having a CASE statement in it.
Code:
SELECT * FROM sales_details;
SELECT
YEAR,
SUM(
CASE
WHEN MONTH = 1
THEN saleAmount
ELSE 0
END
) AS "Month1",
SUM(
CASE
WHEN MONTH = 2
THEN saleAmount
ELSE 0
END
) AS "Month2",
SUM(
CASE
WHEN MONTH = 3
THEN saleAmount
ELSE 0
END
) AS "Month3",
SUM(
CASE
WHEN MONTH = 4
THEN saleAmount
ELSE 0
END
) AS "Month4",
SUM(
CASE
WHEN MONTH = 5
THEN saleAmount
ELSE 0
END
) AS "Month5",
SUM(
CASE
WHEN MONTH = 6
THEN saleAmount
ELSE 0
END
) AS "Month6",
SUM(
CASE
WHEN MONTH = 7
THEN saleAmount
ELSE 0
END
) AS "Month7",
SUM(
CASE
WHEN MONTH = 8
THEN saleAmount
ELSE 0
END
) AS "Month8",
SUM(
CASE
WHEN MONTH = 9
THEN saleAmount
ELSE 0
END
) AS "Month9",
SUM(
CASE
WHEN MONTH = 10
THEN saleAmount
ELSE 0
END
) AS "Month10",
SUM(
CASE
WHEN MONTH = 11
THEN saleAmount
ELSE 0
END
) AS "Month11",
SUM(
CASE
WHEN MONTH = 12
THEN saleAmount
ELSE 0
END
) AS "Month12",
SUM(saleAmount) AS Total
FROM
sales_details
GROUP BY YEAR ;
Output:
Microsoft SQL Server 2005 Pivot
Microsoft SQL Server 2005 introduced the support of pivot statement to get the functionality of crosstab and implement the same.
Let us consider the same above example; we will use the pivot statement, which will help us store the values in temporary variables. Here, we have used 1,2,3, etc., and to replace NULL values with 0, we have made the use of COALESCE function.
Code:
SELECT
YEAR,
COALESCE([ 1,0) ] AS [ January ],
COALESCE([ 2,0) ] AS [ February ],
COALESCE([ 3,0) ] AS [ March ],
COALESCE([ 4,0) ] AS [ April ],
COALESCE([ 5,0) ] AS [ May ],
COALESCE([ 6,0) ] AS [ June ],
COALESCE([ 7,0) ] AS [ July ],
COALESCE([ 8,0) ] AS [ August ],
COALESCE([ 9,0) ] AS [ September ],
COALESCE([ 10,0) ] AS [ October ],
COALESCE([ 11,0) ] AS [ November ],
COALESCE([ 12,0) ] AS [ December ],
[ 1 ] + [ 2 ] + [ 3 ] + [ 4 ] + [ 5 ] + [ 6 ] + [ 7 ] + [ 8 ] + [ 9 ] + [ 10 ] + [ 11 ] + [ 12 ] AS Total
FROM
(SELECT
YEAR,
MONTH,
saleAmount
FROM
sales_details) AS src PIVOT (
SUM(saleAmount) FOR MONTH IN ([1],[2],[3],[4],[5],[6],[7],[8],[9],[10],[11],[12])) AS pvt
ORDER BY YEAR;
Output:
Conclusion
We can reverse the display format of column and row values in the table that transforms the table data by using the cross tab format in SQL. There are mostly two ways of doing so; the standard SQL supports the usage of case statements that can be used to revert the row values to column values and vice versa. In addition, Microsoft SQL Server 2005 introduced the support of pivot statements to get the functionality of crosstab and implement the same.
Recommended Articles
We hope that this EDUCBA information on “SQL Crosstab” was beneficial to you. You can view EDUCBA’s recommended articles for more information.
