


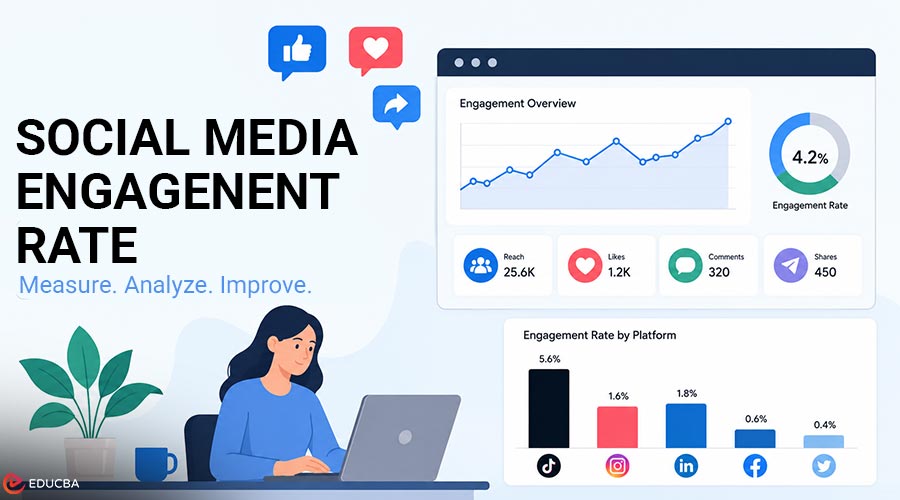
Many brands still measure their social media success only by looking at follower numbers. However, followers alone do not show whether an audience is genuinely interacting with content. A page with 200,000 followers and a 0.3% social media engagement rate may perform worse than a smaller account with 8,000 followers generating a 4% engagement rate. Without regularly measuring engagement rates, businesses often rely on assumptions instead of actual audience behavior when making decisions.
In 2026, when social media feeds are more competitive than ever, understanding the social media engagement rate helps brands identify what content works, measure campaign performance, and improve their overall marketing strategy. This guide explains how to calculate engagement rate across major platforms, including Instagram, TikTok, LinkedIn, Facebook, and X, along with formulas, benchmarks, and best practices.
What Engagement Rate is Actually Measuring?
A social media engagement rate measures how actively your audience interacts with your content instead of simply viewing it. Generally, engagement includes likes, comments, shares, saves, reposts, and story replies (platform-dependent)
The Basic Formula is:
Engagement Rate = (Total Engagements ÷ Audience Size) × 100
The audience size may refer to followers, reach, or impressions. The formula you choose depends on the insights you want to measure. Unlike follower count, engagement reflects genuine audience interest. Social media algorithms on Instagram, TikTok, LinkedIn, and other platforms increasingly prioritize content that generates meaningful interactions.
For example, an AI software development company with only 5,000 LinkedIn followers but consistently active discussions can outperform a competitor with 50,000 inactive followers because engagement sends stronger quality signals to the platform. Saves are another important engagement indicator. Many users also wonder whether people can see what you save on Instagram. The answer is no—saved posts remain private by default, making saves one of the strongest indicators of genuine interest compared to public likes.
There is No Single Social Media Engagement Rate Formula
One of the biggest misconceptions is that there is only one formula for social media engagement rate. In reality, several formulas exist, and each serves a different purpose.
1. Engagement Rate by Followers (ERF)
This is the most commonly used formula.
Formula:
ERF = (Total Engagements ÷ Total Followers) × 100
Many social media analytics tools and Instagram engagement rate calculators use this formula because follower counts are readily available.
ERF works well for:
- Monthly reporting
- Tracking overall account growth
- Comparing long-term performance
2. Engagement Rate by Reach (ERR)
Instead of followers, this method uses the number of unique users who actually saw the content.
Formula:
ERR = (Total Engagements ÷ Reach) × 100
Since reach excludes inactive followers who never viewed the content, ERR often provides a more accurate measure of how well a specific post performed.
ERR is ideal for:
- Individual post analysis
- Campaign evaluation
- Organic content optimization
3. Engagement Rate by Impressions
Some marketers prefer calculating engagement using impressions.
Formula:
Engagement Rate = (Total Engagements ÷ Impressions) × 100
Because impressions include repeat views, this metric is less useful for benchmarking organic performance. However, it becomes valuable when measuring paid advertising performance and cost per engagement (CPE).
Which Formula Should You Use?
A practical approach is:
- Use ERF to monitor account growth over time.
- Use ERR to evaluate how individual posts resonate with viewers.
What Counts as Engagement on Different Platforms?
This trips people up constantly, so it is worth just spelling out. Instagram counts likes, comments, shares, saves, and replies to Stories (though views from an anonymous Instagram Story Viewer would not trigger these metrics). TikTok counts likes, comments, shares, favorites, and sometimes video completions, depending on which tool you are using. LinkedIn counts likes, comments, reposts, and, lately, poll votes and document downloads, too. Facebook sticks to reactions, comments, and shares. X counts likes, replies, reposts, and link clicks in some reporting dashboards, though not in all.
What does not count anywhere is views or impressions. Those measure exposure, not interaction; they are not the same thing, even though people mix them up all the time. If a tool you are using is quietly folding raw view counts into its engagement rate math, that is inflating whatever number it spits out. Worth double-checking the methodology before you trust a report someone hands you.
Likes vs. Saves vs. Shares: Not All Engagement Is Equal
Not every engagement action carries the same weight, and honestly, this has shifted a fair bit these last couple of years. Likes take almost zero effort. That is exactly why they are the weakest signal you have got. Comments show genuine interest, but people do not leave them easily. Saves and shares are where the algorithm’s attention actually sits now, not likes.
A save basically means someone wants to come back to this later, which is a much stronger signal than tapping a heart real quick. A share means someone’s putting their own name next to your content in front of their own audience, which might be the strongest trust signal you can get on social media. If your whole content strategy still revolves around chasing likes, you are optimizing for the wrong thing this year, plain and simple.
Where Engagement Rate Benchmarks Actually Stand in 2026?
A lot of guides out there are still running stale numbers from a year or two back. Instagram engagement has kept sliding, sitting somewhere around 0.3% to 1.1% depending on account size and industry (Reels still pull noticeably more engagement than static posts, sometimes close to double, which should not surprise anyone at this point). TikTok remains the clear leader here, averaging between 3% and 7% depending on your niche, and educational or tutorial content does really well there.
LinkedIn has quietly turned into one of the strongest platforms for engagement growth lately, especially for B2B pages, and yeah, for any AI software development company actually publishing real thought leadership instead of another recycled tips list. Carousels and document posts are beating plain text updates by a wide margin on LinkedIn right now. Facebook organic engagement remains low across most industries, often under 0.3%, making paid boosting almost necessary if reach matters to you at all. X still sits at the bottom, with organic reach mostly limited to niche tech and media accounts; not much has changed there, honestly.
Bigger point buried in all this. Your own follower count changes what “good” even means here. A 2% engagement rate is nothing special for a small niche account, but it is genuinely excellent for a page sitting at half a million followers. Compare against your own tier and industry, not some flat number pulled off a random blog post somewhere.
What is Considered a Good Social Media Engagement Rate?
Improving your engagement rate requires focusing on quality, consistency, and meaningful interactions rather than simply increasing your posting frequency.
- Post Quality Content: Publish fewer but more valuable posts. High-quality content often generates better engagement than frequent posting.
- Create Shareable Content: Focus on checklists, how-to carousels, and useful insights that encourage users to save and share your posts.
- Leverage Micro-Influencers: Nano and micro influencers typically have highly engaged audiences, making them valuable partners for improving engagement.
- Track Multiple Metrics: Monitor both Engagement Rate by Followers (ERF) and Engagement Rate by Reach (ERR) to gain a complete view of content performance.
- Use Analytics Tools: Platforms like Hootsuite, Sprout Social, Buffer, Instagram Insights, and Meta Business Suite help track and analyze your engagement rate efficiently.
In general, an engagement rate between 1% and 5% is considered strong across most social media platforms. However, ideal engagement varies by platform and audience size, with TikTok typically recording higher engagement than Instagram or Facebook.
Final Thoughts
Getting social media engagement rate right really comes down to three things. Pick the right formula for whatever you are trying to measure, know what actually counts as engagement on the platform you are posting to, and benchmark against your own account size and industry instead of some generic number floating around online. ERF works better for tracking trends over time, and ERR gives you a cleaner read on how one specific post actually did.
Platforms have also recently changed what they reward. Because saves and shares now carry greater value than likes, content designed to be saved or shared is likely to outperform posts focused only on generating quick reactions. That holds whether you are running a personal page, an e-commerce brand, or an AI software development company trying to build authority on LinkedIn. Get the formula and the benchmark right, and, honestly, the rest of your social strategy becomes much easier to judge without guessing.
Frequently Asked Questions (FAQs)
Q1. What is a good engagement rate on social media in 2026?
Answer: Somewhere between 1% and 5% is a rough target, but honestly, it varies so much by platform that a single number is not very useful on its own. TikTok tends to sit higher, often at 3–7%, while Instagram and Facebook usually land lower, at 0.3–1.1%. The number only really means something when you compare it to your own platform, industry, and follower size, not to whatever benchmark you saw in someone else’s blog post.
Q2. Should I use ERF or ERR to calculate engagement rate?
Answer: Depends on what you are actually trying to find out. ERF (engagement rate by followers) is the one to use for tracking things month over month, since it provides a consistent baseline. ERR (engagement rate by reach) is better when you want to know whether a specific post genuinely resonated with the people who saw it, since it is not diluted by followers who never even viewed the content.
Q3. Do saves and shares matter more than likes for the algorithm?
Answer: Yes. A like takes almost no effort, so it carries the least weight. A save means someone wants to come back to the content later. A share means they trusted it enough to put it in front of their own audience. Both of those beat alike as far as the algorithm’s concerned.
Q4. What counts as engagement on Instagram, TikTok, and LinkedIn?
Answer: It is not the same everywhere, which is exactly why people get this wrong. Instagram counts likes, comments, shares, saves, and Story replies. TikTok counts likes, comments, shares, and favorites. LinkedIn counts likes, comments, reposts, poll votes, and document downloads. Views and impressions do not count as engagement anywhere, since those measure exposure, not actual interaction.
Q5. Does posting more often improve engagement rate?
Answer: Usually not, past a certain point anyway. Post too much, and engagement just gets spread thinner across more content instead of actually growing. A smaller number of posts built around saves and shares tends to beat high-volume posting most of the time.
Recommended Articles
We hope this guide on social media engagement rate helps you measure and improve your social media performance. Check out these recommended articles for more insights and strategies to grow your online presence.