Updated February 10, 2023
Introduction to Scikit Learn t-SNE
Scikit learn t-sne is used to visualize the data, which is high dimensional; it will be converting similarities between joint probabilities and data points which was trying to minimize the divergence between high dimensional data. Scikit learn is a cost function, and it was not convex, i.e., by using different initialization, we are getting different results. We highly recommend using the reduction method of dimensionality in scikit learn tsne.

Key Takeaways
- The scikit learn tsne will take a high dimensional dataset and reduce the same into a low dimensional graph that retains information.
- Scikit learn tsne is a technique of reduction dimensionality used to represent the dataset in three dimensions.
What is Scikit Learn t-SNE?
Scikit learn tsne is a prevalent reduction technique that was used in dimensionality. Scikit learn tsne generates fewer features, preserving the relationship between samples as much as possible. The full form of scikit learn tsne is T-distributed stochastic neighbor embedding compared with other dimensionality algorithms like PCA, which maximizes the variance.
The scikit learn tsne will create a reduced feature space similar to samples molded with nearby points. The different samples are modeled with the distant points by using high probability. The high-level tsne will construct a probability distribution of the high dimensional samples, such as when it was picked, while different points are tiny.
How to Use Scikit Learn t-SNE?
Below steps shows how we can use the scikit learn tsne as follows:
To use the scikit learn tsne, we must import the matplotlib module.
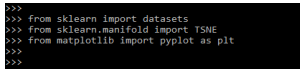
1. At the time of using scikit learn tsne, in the first step, we are importing the sklearn and matplotlib module as follows.
Code:
from sklearn import datasets
from sklearn.manifold import TSNE
from matplotlib import pyplot as plt
Output:
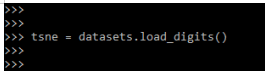
2. While importing the modules now in this step, we are importing the datasets name as load_digits as follows.
Code:
tsne = datasets.load_digits()Output:
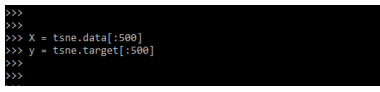
3. After loading the dataset, now in this step, we define the x and y-axis of the dataset as follows.
Code:
X = tsne.data [:500]
y = tsne.target [:500]
Output:
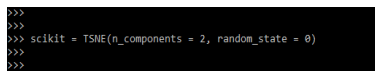
4. After defining the value of the x and y axis in this step, we are transforming the tsne as follows.
Code:
scikit = TSNE()Output:
5. After transforming the tsne, in this step, we are projecting the data in 2d. For projecting the data, we use the variable name proj_2d as follows.
Code:
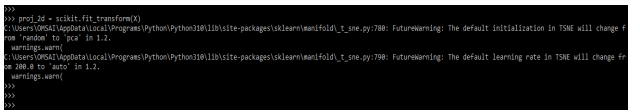
proj_2d = scikit.fit_transform (X)Output:
6. After projecting the data, we use the range function to define the target name.
Code:
ids = range(len(tsne.target_names))Output:
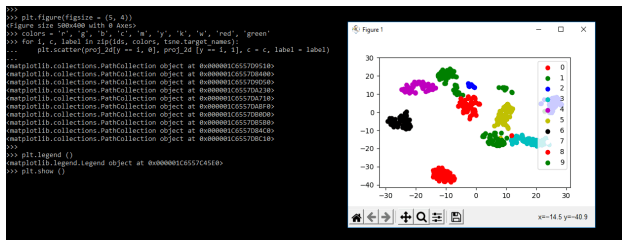
7. After defining the range function, now, in this step, we are plotting the scikit learn tsne figure. Also, we are displaying the same by using the show function as follows.
Code:
plt.figure(figsize = (5, 4))
colors = 'red', 'green'
for i, c, label in zip():
  plt.scatter()
plt.legend ()
plt.show ()
Output:
Scikit Learn t-SNE Visualization
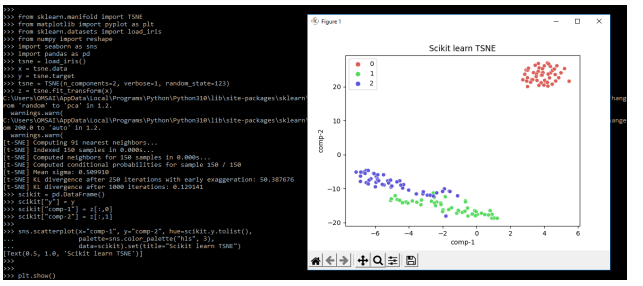
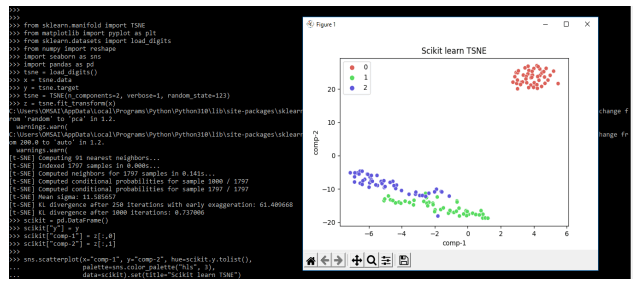
Scikit learn is used to visualize high dimensional data, and tsne is the reduction of nonlinear dimensionality technique used to visualize the data into dimensional space. The API of scikit learn will provide a class of tsne to visualize the data using the tsne method. In the below example, we imagine the plot as follows.
Code:
from sklearn.manifold import TSNE
from matplotlib import pyplot as plt
from sklearn.datasets import load_iris
from numpy import reshape
import seaborn as sns
import pandas as pd
tsne = load_iris()
x = tsne.data
y = tsne.target
tsne = TSNE ()
z = tsne.fit_transform (x)
scikit = pd.DataFrame()
scikit["y"] = y
scikit["comp-1"] = z[:,0]
scikit["comp-2"] = z[:,1]
sns.scatterplot ().set (title="Scikit learn TSNE")
plt.show ()
Output:
We are applying the same data to the digits dataset in the example below. We are importing the same module as follows.
Code:
from sklearn.manifold import TSNE
from matplotlib import pyplot as plt
from sklearn.datasets import load_digits
from numpy import reshape
import seaborn as sns
import pandas as pd
tsne = load_digits()
x = tsne.data
y = tsne.target
tsne = TSNE()
z = tsne.fit_transform(x)
scikit = pd.DataFrame()
scikit ["y"] = y
scikit ["comp-1"] = z [:,0]
scikit ["comp-2"] = z [:,1]
sns.scatterplot().set (title = "Scikit learn TSNE")
plt.show()
Output:
Scikit Learn t-SNE Predictable
The predictability is related to the number of nearest neighbors used in other algorithms. The larger dataset requires more considerable predictability. At the same time, we are selecting a value between 10 and 50. This choice is not critical since the tsne is intensive by using the parameter.
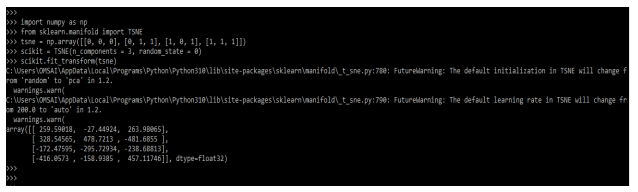
The example below shows how we can plot the array using tsne predictable. In the below example, we are using tsne as follows.
Code:
import numpy as np
from sklearn.manifold import TSNE
tsne = np.array ()
scikit = TSNE()
scikit.fit_transform (tsne)
Output:
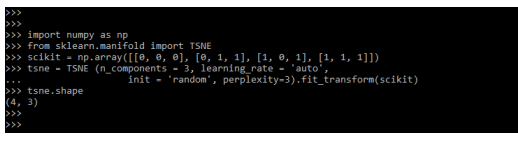
The distance matrix will tell us that samples are part of joint probabilities in scikit learn tsne as follows.
Code:
import numpy as np
from sklearn.manifold import TSNE
scikit = np.array()
tsne = TSNE ().fit_transform(scikit)
tsne.shape
Output:
Examples of Scikit Learn t-SNE
Different examples are mentioned below:
Example #1
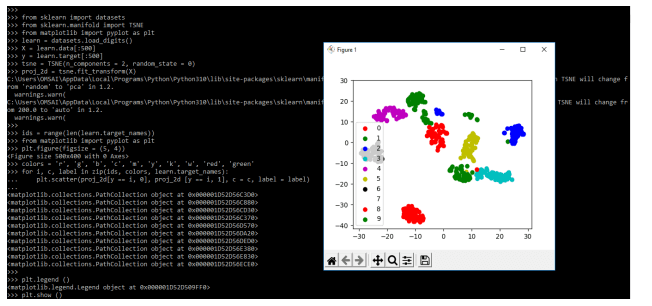
Below is the example of scikit learn tsne as follows. In the below example, we are using the tsne function as follows.
Code:
from sklearn import datasets
from sklearn.manifold import TSNE
from matplotlib import pyplot as plt
learn = datasets.load_digits()
X = learn.data[:500]
y = learn.target[:500]
tsne = TSNE()
proj_2d = tsne.fit_transform(X)
ids = range(len(learn.target_names))
from matplotlib import pyplot as plt
plt.figure(figsize = (5, 4))
colors = 'red', 'green'
for i, c, label in zip():
  plt.scatter()
plt.legend ()
plt.show ()
Output:
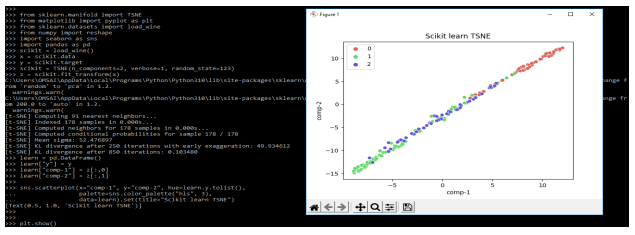
Example #2
The below example shows scikit learn tsne. In the below example, we are loading the load_wine dataset as follows.
Code:
from sklearn.manifold import TSNE
from matplotlib import pyplot as plt
from sklearn.datasets import load_wine
from numpy import reshape
import seaborn as sns
import pandas as pd
scikit = load_wine()
x = scikit.data
y = scikit.target
scikit = TSNE()
z = scikit.fit_transform(x)
learn = pd.DataFrame()
learn["y"] = y
learn["comp-1"] = z[:,0]
learn["comp-2"] = z[:,1]
sns.scatterplot().set(title="Scikit learn TSNE")
plt.show()
Output:
FAQ
Other FAQs are mentioned below:
Q1. Why are we using scikit learn tsne in python?
Answer:
The scikit learn tsne contains many parameters; using the same parameter, we can also draw the graph and predict the data visualization using tsne.
Q2. What is scikit learn tsne visualization?
Answer:
The scikit learn tsne tool was used to visualize the high dimensional data. The API of scikit learn will provide the tsne class using the method of tsne.
Q3. How can we visualize digits using scikit learn tsne?
Answer:
We can use the various function to visualize the digits datasets. We can imagine all the default datasets.
Conclusion
Scikit learn tsne is a prevalent reduction technique that was used in dimensionality. Scikit learn tsne is too used to visualize the high dimensional data; it will convert similarities between joint probabilities and data points, trying to minimize the divergence between high dimensional data.
Recommended Articles
This is a guide to Scikit Learn t-SNE. Here we discuss the introduction, visualization, and how to use scikit learn t-SNE with examples and FAQ. You may also have a look at the following articles to learn more –
