Updated March 17, 2023
Introduction to Scikit Learn Metrics
Scikit learn metrics are used to implement the function assessing the prediction error for a specified purpose. Multiple types of scikit learn metrics are available in the module of sklearn. The module of sklearn metrics implements several utility functions and measures the classification’s performance. Some of the metrics in scikit learn will require positive probability estimates of the class.

Key Takeaways
- The scikit learn metrics or machine learning metrics measure the performance of the ML model from the specified task.
- The scikit model is used to describe whether the model is ok or not; this task is any task that defines regression, clustering, and classification.
Overview of Scikit Learn Metrics
Implementing scikit learn metrics allows each sample to provide the weighted contribution for the overall score using the sample weight parameter. In Multilabel learning, each sample contains the number of ground associated with the same. The goal is to give a better rank and high scores for the ground labels. The coverage error function will compute the average number of labels included in the final prediction, such as all predicted labels. This is very useful when we want to know the scored labels which were expected without missing.
The sklearn metrics module implements several utility functions for measuring regression performance. Some of those are enhanced by handling the multi-output case. The sklearn metrics function contains the argument of multi-output keywords, specifying how the scores for each target were averaged. The default value is uniform_average, specifying the uniformly weighted means over the outputs. If suppose ndarray is passed, then the entry is interpreted.
Scikit Learn Metrics Report
The report is a performance evaluation metric that was used in machine learning. It is used to show the precision and supports the trained classification model. Suppose we have performance evaluation metrics of a classification-based machine learning model displaying the model precision-recall and support.
The report provides a better understanding of the overall performance of our trained model. To understand the metrics report of the machine learning model, we know all the metrics displayed in the report. To view the metrics reports of scikit learn, we first need to train the machine learning model.
Code:
import pandas as pd
import numpy as np
from sklearn.feature_extraction.text import CountVectorizer
from sklearn.model_selection import train_test_split
from sklearn.naive_bayes import MultinomialNB
from sklearn.metrics import classification_report
metrics = pd.read_csv(" ", encoding= 'latin-1')
metrics = metrics[["class", "message"]]
metrics_x = np.array(metrics["message"])
metrics_Y = np.array(metrics["class"])
met = CountVectorizer()
X = met.fit_transform (metrics_x)
X_train, X_test, y_train, y_test = train_test_split()
met_model = MultinomialNB()
met_model.fit (X_train,y_train)
pre = met_model.predict (X_test)
print(classification_report(y_test, pre))
Output:
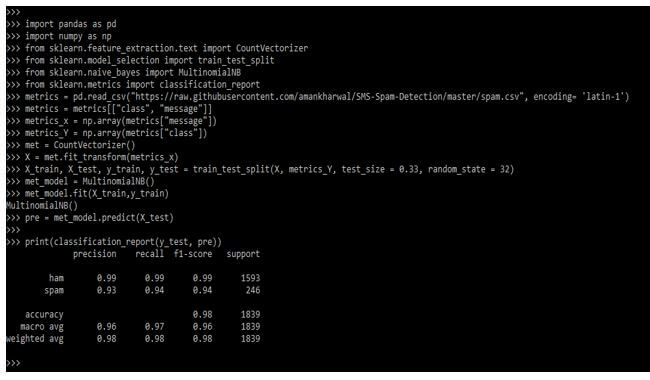
Below are the metrics which was displayed while displaying the report. In the above example, we have defined these metrics.
- Precision: It is defined as the ratio of the sum of the true and false positive values.
- Recall: The ratio of the sum of false negative and true positive values.
- F1 score: The f1 is a weighted harmonic mean of recall and precision. The close value score is 1.0, which we have defined in the performance model.
- Support: This is defined as actual occurrences of the dataset class.
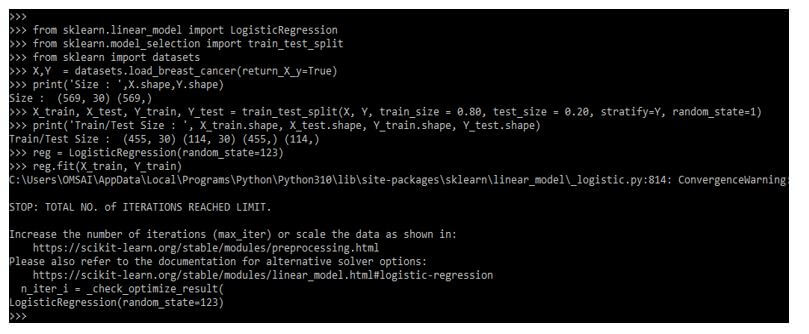
Scikit Learn Metrics Functions
There are multiple metrics functions available in scikit learn. In the example below, we classify the simple classification metrics available in scikit learn.
Code:
from sklearn.linear_model import LogisticRegression
from sklearn.model_selection import train_test_split
from sklearn import datasets
X,Y = datasets.load_breast_cancer()
print('Size : ',X.shape,Y.shape)
print('Train/Test Size : ', X_train.shape)
reg = LogisticRegression()
reg.fit(X_train, Y_train)
Output:
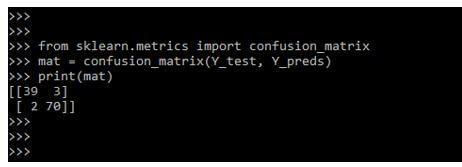
For binary classification problems, the confusion metric is another metric that helps us identify which class is easy to predict and which class is hard to predict. The below example shows the function of confusion metrics as follows.
Code:
from sklearn.metrics import confusion_matrix
mat = confusion_matrix(Y_test, Y_preds)
print(mat)
Output:
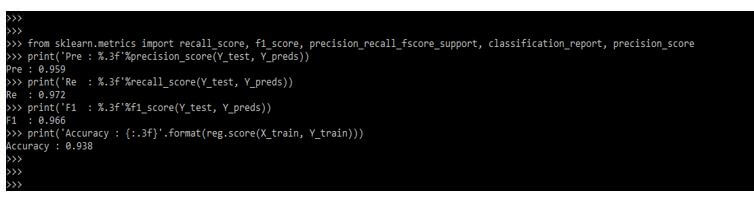
The classification metrics provide whole reports of the classification function as follows. In the below example, we are defining support, recall, precision, and f1-score as follows.
Code:
from sklearn.metrics import recall_score, f1_score,
precision_recall_fscore_support, classification_report, precision_score
print ('Pre : %.3f'%precision_score(Y_test, Y_preds))
print ('Re : %.3f'%recall_score(Y_test, Y_preds))
print ('F1 : %.3f'%f1_score(Y_test, Y_preds))
print ('Accuracy : {:.3f}'.format(reg.score (X_train, Y_train)))
Output:
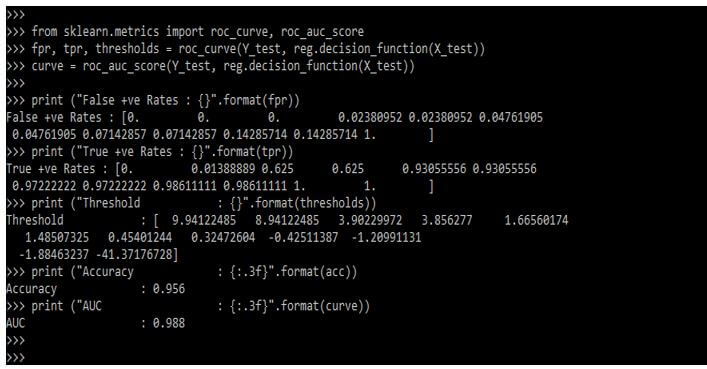
The below example shows that the ROC curve and ROC AUC function are as follows.
Code:
from sklearn.metrics import roc_curve, roc_auc_score
fpr, tpr, thresholds = roc_curve (Y_test, reg.decision_function(X_test))
curve = roc_auc_score (Y_test, reg.decision_function (X_test))
print ("False +ve Rates : {}".format(fpr))
print ("True +ve Rates : {}".format(tpr))
print ("Threshold : {}".format(thresholds))
print ("Accuracy : {:.3f}".format(acc))
print ("AUC : {:.3f}".format(curve))
Output:
Parameters
This parameter defines the accuracy classification score.
- y_true: This parameter defines the correct labels of it.
- y_pred: This represents the predicted labels returned by using the classifier.
- Normalize: If this parameter is false, it will return classified samples.
- sample_weights: It defines the sample weights.
- Score: It returns the fraction of correctly classified samples.
- score_func: It will define the score function with a signature.
- greater_is_better: The default value of this parameter is true, and the type is bool.
- needs_proba: The default value of this parameter is false, and the type is bool.
- needs_threshold: The default value of this parameter is false, and the type is bool.
- Kwargs: This defines an additional parameter passed with the score_func parameter.
- Scorer: It is a callable object returning the scalar score.
Examples of Scikit Learn Metrics
Different examples are mentioned below:
Example #1
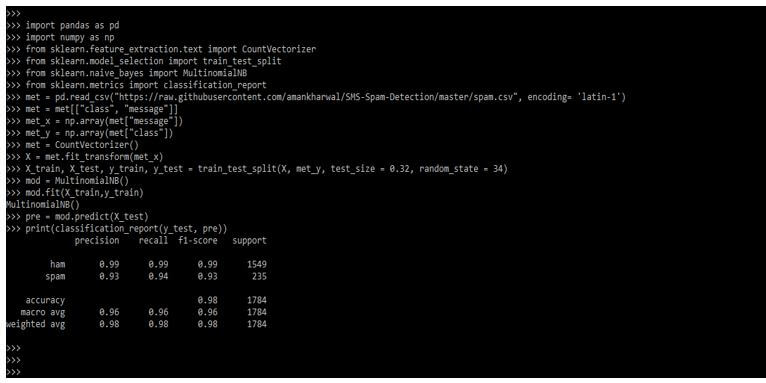
In the below example, we are printing the classification report.
Code:
import pandas as pd
import numpy as np
from sklearn.feature_extraction.text import CountVectorizer
from sklearn.model_selection import train_test_split
from sklearn.naive_bayes import MultinomialNB
from sklearn.metrics import classification_report
met = pd.read_csv(")
met = met[["class", "message"]]
met_x = np.array(met["message"])
met_y = np.array(met["class"])
met = CountVectorizer()
X = met.fit_transform(met_x)
X_train, X_test, y_train, y_test = train_test_split()
mod = MultinomialNB()
mod.fit(X_train,y_train)
pre = mod.predict(X_test)
print(classification_report(y_test, pre))
Output:
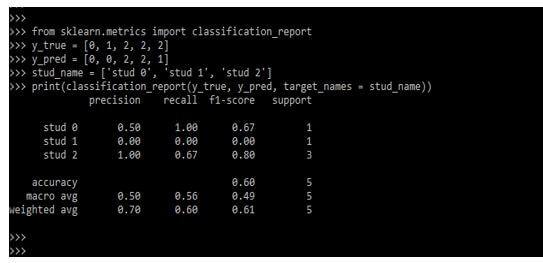
Example #2
We are creating a classification report in the below example by defining our values.
Code:
from sklearn.metrics import classification_report
y_true = [ ]
y_pred = [ ]
stud_name = ['stud 0', 'stud 1', 'stud 2']
print(classification_report(y_true, y_pred, target_names = stud_name))
Output:
FAQ
Other FAQs are mentioned below:
Q1. Why are we using metrics in python?
Answer:
It is used to find the specified model’s accuracy, regression, clustering, or classification. Metrics will represent multiple accuracies of the data.
Q2. Which libraries are we using in metrics?
Answer:
We use sklearn, numpy, matplotlib, and pandas library in metrics. Those libraries are used in other functions as well.
Q3. What is classification accuracy in scikit learn metrics?
Answer:
The classification accuracy is the number of true predictions divided by the total number of samples; it will be a telling potion of percentage.
Conclusion
This is very useful when we want to know the scored labels which were predicted without missing. It is used to implement the function assessing the prediction error for a specified purpose. There are multiple types of it available in the module of sklearn.
Recommended Articles
This is a guide to Scikit Learn Metrics. Here we discuss the introduction, scikit learn metrics report & functions, parameters, examples, and FAQ. You may also have a look at the following articles to learn more –
