Updated May 4, 2023
Difference Between R vs SPSS
R and SPSS are the two industry-leading technologies for statistical data analysis. R is an open-source programming language widely used as the preferred option for analytics. Whereas SPSS is known as Statistical Package for social science, owned by IBM. R is the scripting language and supports limited Graphical User Interface features compared to IBM SPSS, which has built-in data quality processing and analysis features. R has several package support from the community user. Whereas IBM fully manages SPSS for support and features enhancement. R is known for its customization visualization support, whereas SPSS is limited to visualization features.
Head-to-Head Comparison Between R vs SPSS (Infographics)
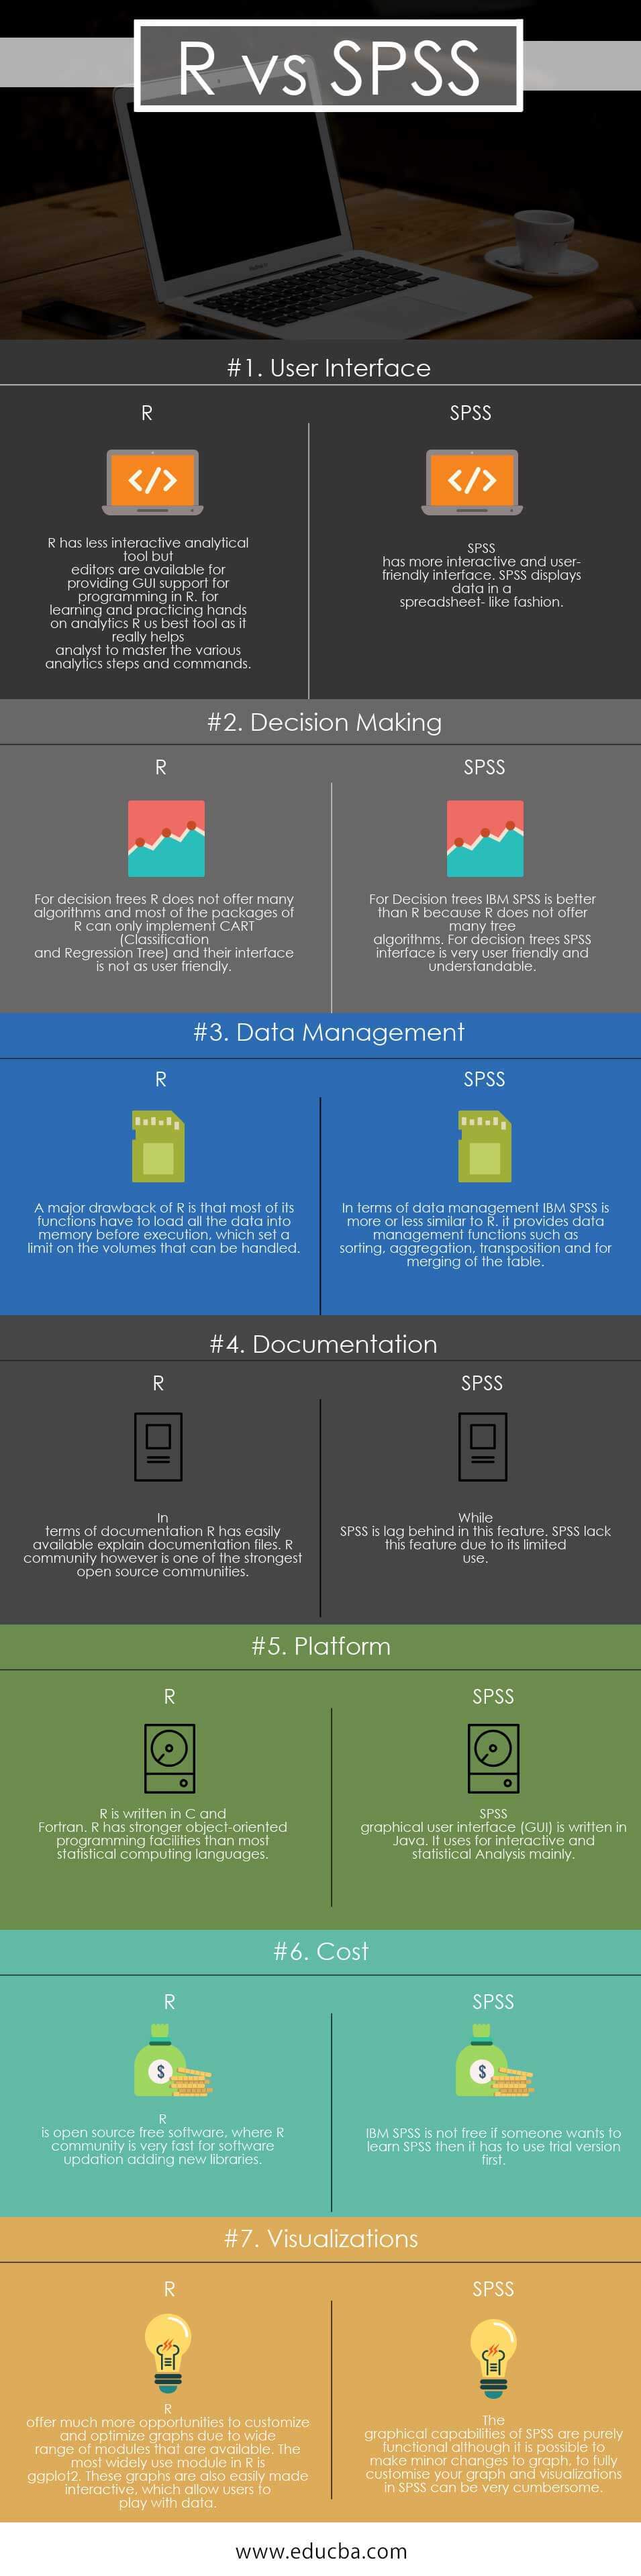
Below are the top 7 comparisons between R vs SPSS:
Key Differences Between R vs SPSS
Below are the most important key differences between R vs SPSS:
- R is open-source, free software, where the R community is fast for software updates adding new libraries regularly new version of stable R is 3.5. IBM SPSS is not free. If someone wants to use SPSS software, it has to download the trial version first; due to the cost-effectiveness of SPSS, most start-ups opt for R software.
- R is written in C and Fortran. R has stronger object-oriented programming facilities than SPSS, whereas SPSS’s graphical user interface uses Java. It is mainly used for interactively and statistical analysis.
- In statistical analysis decision trees, R does not provide many algorithms, and most of the packages of R can only implement Classification and Regression Trees, and their interface is not as user-friendly. On the other hand, Decision trees in IBM SPSS are better than R because R does not offer many tree algorithms. For decision trees, the SPSS interface is very user-friendly, understandable, and easy to use.
- R has a less interactive analytical tool than SPSS. Still, its editors are available to provide GUI support for programming in R. R is the best tool for learning and practicing hands-on analytics, as it helps the analyst master the various analytics steps and commands. Moreover, the SPSS interface is more or less similar to an Excel spreadsheet.
- R offers much more opportunities to modify and optimize graphs due to the wide range of available packages. The most widely used package in R is ggplot2 and R shiny. Users can easily make graphs interactive in R, which enables them to manipulate data. In SPSS, graphs are less interactive than in R, where you can create only basic and simple graphs or charts. Data management in both R and SPSS is almost the same. A significant drawback of R is that most functions load all the data into memory before execution. In contrast, SPSS provides data management functions such as sorting, aggregation, transposition, and merging of the table.
R vs SPSS Comparison Table
Below is the comparison table of R vs SPSS:
| Basis for Comparison | R | SPSS |
| User Interface | R has the less interactive analytical tool, but editors are available to provide GUI support for programming in R. R is the best tool for learning and practicing hands-on analytics, as it helps the analyst master the various analytics steps and commands. | SPSS has a more interactive and user-friendly interface. SPSS displays data in a spreadsheet-like fashion. |
| Decision Making | For decision trees, R does not offer many algorithms. Most of the packages of R can only implement CART (Classification and Regression Tree), and their interface is not as user-friendly. | For Decision trees, IBM SPSS is better than R because R does not offer many tree algorithms. For decision trees, the SPSS interface is very user-friendly and understandable. |
| Data Management | A significant drawback of R is that most of its functions have to load all the data into memory before execution, which limits the volumes that can be handled. | In data management, IBM SPSS is more or less similar to R. It provides data management functions such as sorting, aggregation, transposition, and merging of the table. |
| Documentation | In terms of documentation, R has readily available explain documentation files. R community, however, is one of the strongest open-source communities. | While SPSS is lagging in this feature, SPSS lacks this feature due to its limited use. |
| Platform | R is written in C and Fortran. R has stronger object-oriented programming facilities than most statistical computing languages. | The graphical user interface (GUI) of SPSS is written in Java and primarily used for interactive and statistical analysis. |
| Cost | R is open-source, free software, where the R community is very fast for software updates and adding new libraries. | IBM SPSS is not free. If someone wants to learn SPSS, they must use the trial version first. |
| Visualizations | R offers much more opportunities to customize and optimize graphs due to the wide range of available modules. The most widely used module in R is ggplot2. These graphs are also easily made interactive, which allows users to play with data. | The graphical capabilities of SPSS are purely functional. However, it is possible to make minor changes to the graph; fully customizing your graph and visualizations in SPSS can be very cumbersome. |
Conclusion
R and SPSS are both analytics tools and have excellent career potential. Since R is open source, one could quickly learn and implement it. You need to buy a license to use SPSS permanently, but you can learn SPSS using the trial version provided by IBM. If someone is new to data analytics, then SPSS is a better choice because of its user-friendly interface to perform statistical analysis efficiently. Fr m SPSS, you can create basic visualization. R can overcome this problem; R has a wide range of visualizations. In R, you can use ggplot2 and R shiny to perform visualizations. R s best for (EDA) exploratory data analysis. R and SPSS are both slow when it comes to handling large data. To solve this problem, you have to go for another tool.
Recommended Articles
This has been a guide to R vs SPSS. Here we have discussed R vs SPSS head-to-head comparison, key differences, infographics, and comparison table. You may also look at the following articles to learn more –
