Updated October 9, 2023

Quantitative Research Examples – Introduction
Quantitative research is a systematic approach to collecting and analyzing data from various sources. It uses statistical, computational, and mathematical methods to extract valuable findings and draw conclusions. In this article, you will see different quantitative research examples, explaining how to collect and analyze data in quantitative research.
7 Easy Quantitative Research Examples
Let us first see a few simple hypothetical quantitative research examples (Example #1 to Example #4).
Example #1
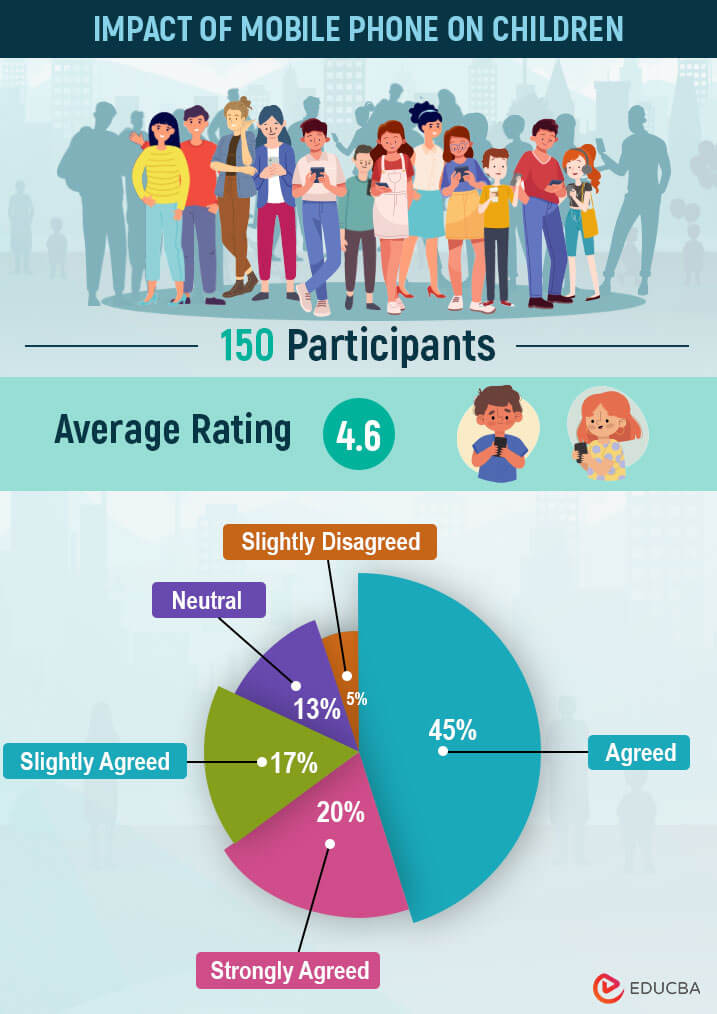
Consider a researcher who conducted a quantitative survey among parents of children aged 1-8 years to study how many parents are fine with their children using phones. A total of 150 participated in the survey, where they rated their agreement on a 7-point scale.
| Rating | 1 | 2 | 3 | 4 | 5 | 6 | 7 |
| Agreement Level | Strongly Disagree | Disagree | Slightly Disagree | Neutral | Slightly Agree | Agree | Strongly Agree |
Method: To find the average perspective of parents on giving mobile phones to children, the researcher finds the average of all 150 collected values (Sum of all values ÷ 150).
Result: The results of the survey show the following insights:
- The average rating was 4.6, indicating a tendency towards agreement regarding giving mobile phones to children.
- 20% of respondents “strongly agreed” (rated 7), 45% “agreed” (rated 6), and 17% “slightly agreed” (rated 5).
- 13% of respondents were “neutral” (rated 4).
- Only 5% “slightly disagreed” (rated 3), and 0% “disagreed” or “strongly disagreed.”
We can see from the analyzed data that most parents are more likely to provide their children with mobile phones in today’s technological world.
Example #2
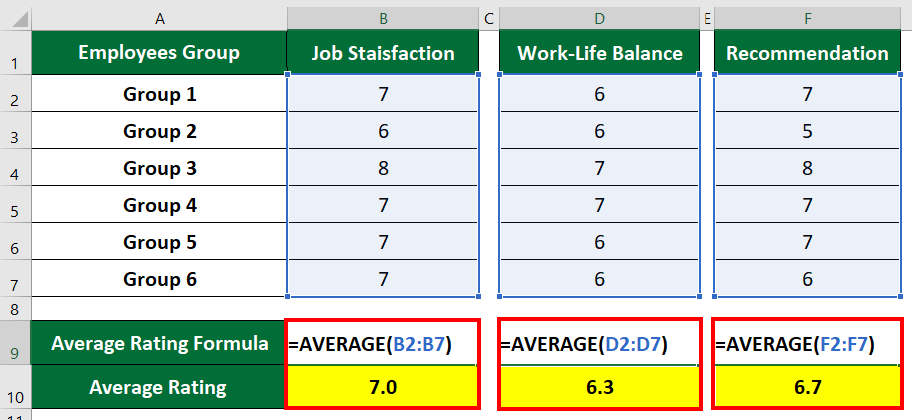
Suppose a startup company, BVN corporation, wants to test their employee’s satisfaction levels. The company divides the employees into six groups of 5 employees each. They then conduct a survey asking the following questions where the answers must range from 1 (lowest) to 10 (highest).
- Are you satisfied with the job?
- What is your level of satisfaction with your work-life balance?
- Would you recommend BVN corporation to other employees?
Method:
- Once the employer gathers data from each employee in Group 1, they calculate the average rating for that group. They repeat this process for all the other groups.
- Then, they determine the overall average for each aspect (like job satisfaction or work-life balance) by considering all the groups together.
Result:
The following image depicts the rating given by groups and the overall average rating.
The interpretation of the results is as follows.
- The average rating for job satisfaction among all groups is 7.0, meaning that employees are moderately satisfied with their jobs.
- The average rating for work-life balance is 6.3. It means that employees are unsatisfied and the company needs some improvement.
- The average rating for recommendations is 6.7. This score shows that employees have some good feelings towards the company. However, a company can improve its environment or culture to improve the recommendation ratings.
Example #3
Let’s say a hospital performs quantitative research to analyze how efficient the hospital’s operations are. The hospital conducts a survey to collect data from both doctors and patients.
The survey included questions such as:
- How much time does the doctor take for one patient? (Options: <10 mins, 10 to 30 mins, 30-50 mins, and 50+ mins).
- How often does a patient come into the hospital? (1 time, 2-4 times, 4-8 times, and 8+ times)
- Rate your (patient) satisfaction level (scale of 1 to 10).
Method:
After getting all the information, the researcher determines the option that most people choose. For example, if 6 out of 10 people picked “<10 mins” for “How long the doctor spends with each patient?”, that’s what they consider as the average.
Result: The following are the key results from the survey.
- The average time spent by a doctor for one patient varies from 10-30 mins.
- The average number of patient visits per month is 3.
- The average satisfaction of patients following doctor consultations is 7.
Example #4
Let’s consider an NGO that wants to run an educational program in the village. Their aim is to improve the literacy rate in the village. However, before they launched the program, first, the organization first surveyed the entire village population (N=450) to know how many were likely to participate.
Result:
In the survey, the NGO found that Individuals aged 30-45 showed 60% interest, while those below 30 years showed 45% interest, and those above 45 years showed 40% interest. Finally, 50% (225) of the village population participated in the program.
The four examples we just saw were simple hypothetical quantitative research examples. Now, let us see some real-life examples of quantitative research.
Example #5
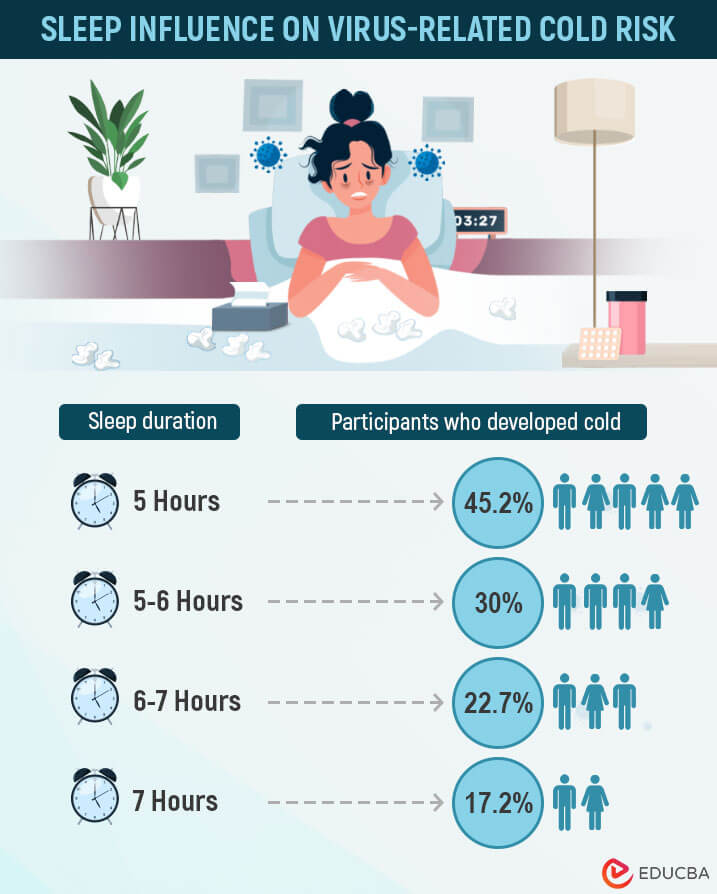
In 2015, researchers conducted an experimental study on the effect of lack of sleep on colds. The study was a two-part experiment conducted on 164 healthy individuals. Participants had to record their one-week bedtime in the first part. In the second part, researchers quarantine the participants in a hotel and give them nose drops containing virus-causing colds, i.e., rhinovirus.
Data collection method:
Participants recorded their bedtime, like sleeping and waking up time. Also, researchers used wrist actigraphy data to monitor sleep movement. Blood samples were collected to check the level (number) of rhinovirus antibodies. Tissues with mucus were used as a sign of illness, meaning if a participant used 10g or more tissues, they were sick.
Method:
The researchers used SPSS, a computer program, and logistic regression to predict which participants got colds and which didn’t. After that, they grouped the participants into categories based on how much they slept and, among those, how many people caught a cold.
Result:
A few highlights from the study were as follows:
- Of 164 participants, 124 received the virus, and only 48 among the 124 got sick.
- Individuals who slept less than 5 hours during night-time were 4.5 times more likely to get sick.
- Those who slept 5 -6 hours were 4.2 times more likely to get sick.
- Participants who slept for 7+ hours had very low chances of catching a cold.
The image below shows the correlation between the total % of participants who got the cold and their respective sleeping hours.
Example #6
In April 2020, researchers conducted a cross-sectional survey in Bangladesh to explore the total sleep duration, night-time sleep, and daily naptime. 9,730 participants took a survey, including a questionnaire related to socio-demographic variables (age, gender, occupation), behavioral and health factors (smoking, alcohol consumption), depression, suicidal thoughts, night sleep duration, naptime duration, etc.
Data collection method: In this study, researchers collected the data through online survey forms from participants aged 18–64 in Bangladesh.
Analysis tools: SPSS 25.0, Stata 16, ArcGIS 10.7, etc.
Method:
The researchers made digital maps of Bangladesh using GIS mapping. They divided the maps into different sections to show nap times, how long people slept at night, and the total sleep duration. They also made another map that revealed how areas with COVID-19 cases related to the amount of sleep people got at night in those places.
Result:
Using the GIS maps, the researchers observed the following:
- The study found that 64.7% slept for 7-9 hours at night, and the daily nap duration was 30-60 mins for 43.7% of participants.
- Sleep duration was affected by unemployment, marital status, self-isolation, smoking cigarettes, social media use, financial difficulties, and depression.
- Barisal region had 24% of participants with nap durations over 1 hour, and Rangpur had 67.60% with 7-9 hours of nightly sleep.
Example #7
A study conducted in Kerman, Iran, in 2010-2011, wanted to find the correlation between computer games and behavioral problems in adolescent boys. The study involved 384 male school students with a questionnaire and Achenbach’s Youth Self-Report (YSR) to assess their behavior problems. The YSR evaluates various issues, such as anxiety, depression, social problems, and more, comprising 10 categories.
Data collection method: The students filled out the questionnaire form regarding computer game usage, including how likely they were to play those games and if they contained any violent content.
Analysis tools: Bivariate regression, ANOVA, and SPSS 20.0.
Method:
In the questionnaire, participants listed their top five favorite video games and rated their frequency of play, the level of violent content, and the presence of violent images on a 7-point scale. To calculate the exposure score, the researchers added the content and image scores and multiplied the result by the play frequency divided by 5.
In the YSR questionnaire, participants rated each game on a 5-point scale. To get dimension scores, the researchers totaled the scores for each item. Finally, they summed up the dimension scores to calculate the total score (all items combined).
Result:
The study found that:
- There is a 95% correlation between time spent on computer games and students’ depression/anxiety, social problems, aggressive behavior, and more.
- Researchers observed that 17% showed aggressive behaviors, 12% had depression/anxiety, 9% had rule-breaking problems, and 6.4% had social issues.
Final Thoughts
Quantitative research examples rely on factual information, numerical data, and statistics. Its main advantage lies in the ease of predicting outcomes. Researchers gather information through different tools, equipment, surveys, questionnaires, quantified behaviors, and research methods, among other variables.
Recommended Articles
This article is a complete guide to different quantitative research examples. You can also go through our other suggested articles to learn more.

