What is the Production Possibility Frontier?
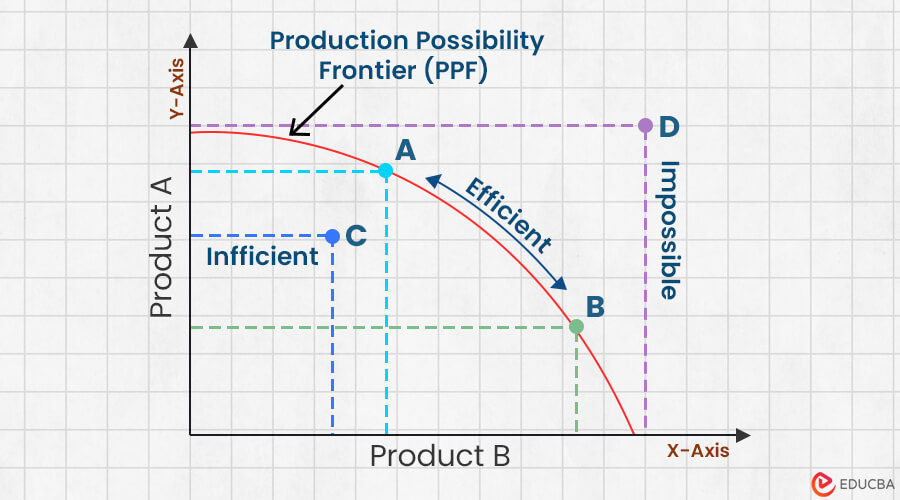
A production possibility frontier (PPF) is a curve on a graph that shows different points. These points represent how a business can produce two different products using available resources to attain maximum productivity.
A production possibility frontier in economics actually shows the trade-offs between the two products. This shows how a company can use its limited resources to produce two products, for example, tablets and smartphones. Each point on the curve represents the most efficient way of using resources to produce tablets and smartphones. Making quantities above and below these points could produce more of one quantity, either tablets or smartphones.
So, if an economy uses its resources to produce more quantity of one kind of good, it must produce fewer quantities of another good.
In simple terms, the PPF answers three fundamental economic questions:
- What to produce?
- How much to produce?
- What must be given up to produce more of something else?
Table of Contents
- What is it?
- Understanding PPF (with simple example)
- PPF Graph (with advanced example)
- Model
- What Shifts the PPF?
- Importance in Economics
- Difference Between PPF and PPC
Understanding Production Possibility Frontier (With Simple Example)
Let’s consider a scenario of a farmer, David, who produces rice and corn. The production possibility frontier curve will help David determine the maximum quantities of rice and corn he can produce with the available resources, such as land, labor, and capital. Here, the curve represents the quantity of rice on the X-axis and the quantity of corn on the Y-axis. Therefore, each point represents the combination of rice quantity and the corresponding corn quantity he can produce with available resources.
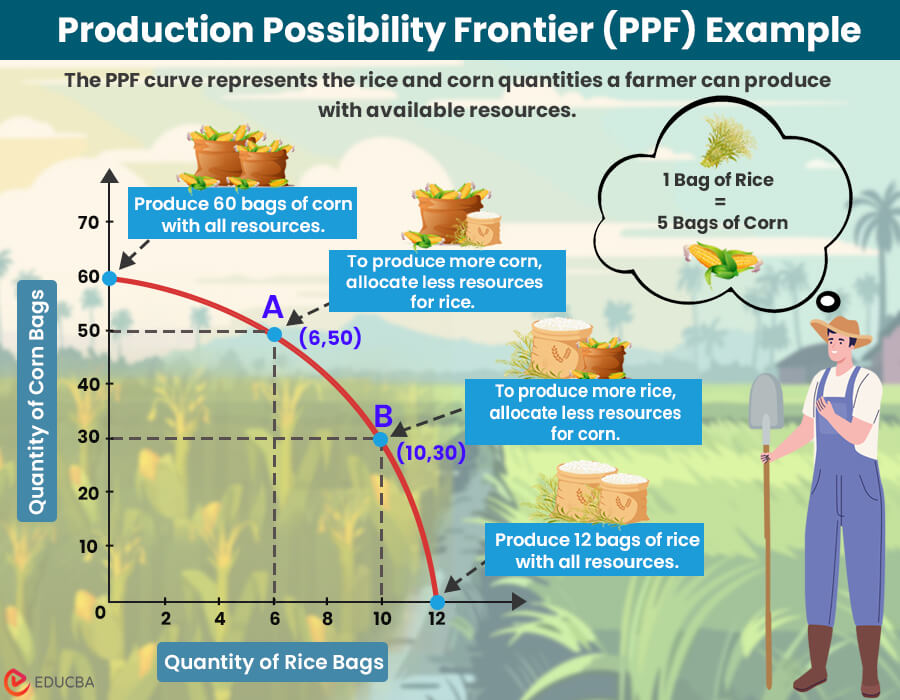
We can make the following observations from the graph:
- If David uses all his resources to produce only corn, he can produce 60 bags. The point would be at the extreme left of the curve.
- If he uses all its resources to produce only rice, he can produce 12 bags of rice and no corn. The point would be at the extreme right of the curve.
- If he uses its resources to produce 50 bags of corn, he can produce 6 bags of rice.
- Also, if he wants to produce more rice, he would have to allocate fewer resources to produce corn, so with 10 bags of rice, he can only produce 30 bags of corn.
From the graph, we can see that for 1 bushel of rice, he can produce 5 bags of corn from his available resources. Therefore, the points on the graph can help him determine the combination of rice and corn quantities he can produce to maximize his production.
Production Possibility Frontier Graph (With Advanced Example)
The following is an example of a production possibility frontier to understand the graph.
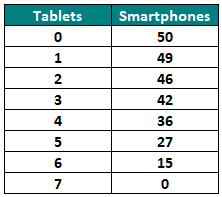
Imagine a company that makes tablets and smartphones. With limited resources or materials, they produced the following number of tablets and smartphones.
Solution:
Now, we can use this data to create a PPF curve showing the different product combinations the company produced with limited materials.
Let’s plot these points on the Production Possibility Frontier PPF graph.
Where,
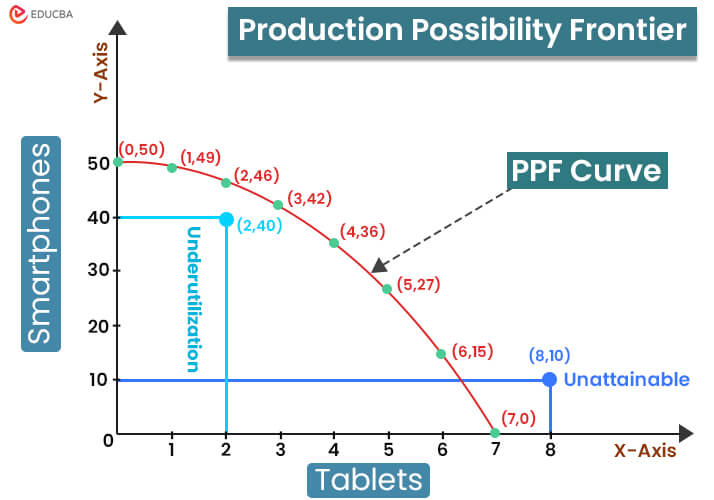
- X-axis: Represents the number of tablets.
- Y-axis: Represents the number of smartphones.
A) Meaning of different points on the above PPF graph:
- Point (0, 50): When the company allocated all its resources to producing smartphones, it produced 50, which means no resources were available for tablet production.
- Point (1, 49): As the company started to produce tablets, it allocated a few resources to make them. So, to make 1 tablet, the company produced 49 smartphones. This moved the curve to the right on the graph, indicating a slight decrease in smartphone production.
- Point (2, 46): Now, they produced one more tablet, which caused a further shift of the curve on the right side. At this point, smartphone production decreased to 46.
- Point (3, 42): Further, the company allocated more resources to producing 3 tablets. This reduced the number of smartphones produced to 42 and shifted the curve downward.
- Point (4, 36): As the company increased tablet production to 4, smartphone production decreased to 36. This indicates the company is allocating more resources to tablet production. Here, the curve moves further to the right side and downward.
- Point (5, 27): At this point, the company produced 5 tablets and 27 smartphones. The trade-off between tablets and smartphones continues, further decreasing smartphone production.
- Point (6, 15): Here, the company produced 6 tablets, and smartphone production decreased to 15. The company used the majority of its limited resources in tablet production. The trade-off persists, moving the curve downward.
- Point (7, 0): At this extreme point, the company used all resources and focused entirely on tablet production (7), producing no smartphones (0). The point on the curve finally reached the extreme right side.
Considering its limited resources, the above points show the different quantities of tablets and smartphones the company can produce.
B) Interpretation of the PPF graph
| Aspect | Points on the Graph | Interpretation |
| Efficient Points | Points on the graph, like (0, 50), (2, 46), (7, 0). | These points represent that the company fully utilizes its resources to produce an optimal number of tablets and smartphones. |
| Trade-offs | Tablet ↑, Smartphone ↓ (7, 0). Tablet ↓, Smartphone ↑ (1, 49). |
The graph shows the trade-off between tablets and smartphones. It means the more tablets the country makes, the fewer smartphones it can produce, and vice versa. |
| Underutilization | Suppose the company produced 2 tablets and 40 smartphones (2,40). | This point deviates from the efficient points, which shows underutilization. Meaning that the company is not using all its resources efficiently. It could make tablets and smartphones at a 2:46 or 3:42 ratio to attain maximum profit. |
| Unattainable | Suppose the company produced 8 tablets and 10 smartphones (8,10). | This point moves outside the main curve and shows an unattainable feature. It shows that current available resources may not be sufficient to produce this desired quantity (8,10). Achieving this point would require more resources or better technology. |
Model of the Production Possibility Frontier
The Production Possibility Frontier (PPF) model explains how an economy allocates its limited resources to produce two goods efficiently. It highlights the concepts of scarcity, choice, opportunity cost, and efficiency.
The PPF model relies on the following key components:
1. Scarcity of Resources: The model assumes that resources such as land, labor, capital, and technology are limited. Because of this scarcity, an economy cannot produce unlimited quantities of all goods and must make choices.
2. Efficient Use of Resources: Points on the PPF curve represent efficient production levels, where the economy fully utilizes all available resources without any waste.
3. Inefficient Production: Points inside the PPF curve indicate underutilization of resources, such as unemployment, idle machinery, or poor resource management. At these points, the economy can increase production without sacrificing other goods.
4. Unattainable Production: Points outside the PPF curve are unachievable with current resources and technology. Reaching these points requires technological progress or increased resources.
5. Trade-Offs Between Goods: The PPF model shows that producing more of one good requires producing less of another. This trade-off reflects the fundamental economic problem of choice.
6. Opportunity Cost: The slope of the PPF curve represents the opportunity cost, which is the quantity of one good sacrificed to produce more of another good. Opportunity cost usually increases as production shifts from one good to another.
7. Fixed Technology (Short-Run Assumption): The model assumes that technology remains constant in the short run. Any technological advancement shifts the PPF curve outward, indicating higher production capacity.
8. Two-Goods Economy: For simplicity, the PPF model assumes that an economy produces only two goods. This helps visualize trade-offs, even though real economies produce many goods.
9. Full Employment Assumption: The PPF assumes that the economy fully employs all available resources at points on the curve. Any unemployment or inefficiency moves the economy inside the curve.
10. Basis for Economic Growth Analysis: The PPF model helps analyze economic growth. An outward shift in the curve indicates growth driven by better technology, increased resources, or improved productivity.
What Shifts the PPF?
Several factors can shift the Production Possibility Frontier (PPF), indicating changes in an economy’s production capacity. These shifts show whether an economy can produce more or fewer goods than before.
- Technological advancements: Improvements in technology enable producers to increase output with the same resources. As efficiency increases, the PPF shifts outward, showing higher production potential.
- Changes in resource quantity: An increase in resources such as labor, land, or capital expands production capacity and shifts the PPF outward. Conversely, a reduction in resources shifts the PPF inward.
- Improvement in resource quality: Better education, training, and skill development improve labor productivity. Higher-quality resources enable greater output, leading to an outward shift of the PPF.
- Institutional and policy changes: Government policies like taxation, subsidies, trade policies, and regulations affect production efficiency. Supportive policies can shift the PPF outward, while restrictive policies may shift it inward.
- Natural and external factors: Events such as natural disasters, wars, pandemics, or global economic crises can damage resources and infrastructure, reducing productive capacity and shifting the PPF inward.
- Investment in capital goods: Increased investment in machinery, infrastructure, and research enhances future production capacity, thereby shifting the PPF outward over time.
Why is PPF Important in an Economy?
The importance of the production possibility frontier in economics is as follows.
1. Helps in the efficient allocation of resources
PPF helps understand the trade-offs, enabling decision-makers to allocate resources efficiently to produce two different goods. They can also use different economic systems, such as market economies and supply-and-demand, to determine production quantities.
2. Helps in production decision-making
Decision-makers use PPF to make informed choices about the combination of goods to produce, taking into account opportunity costs and resource constraints.
3. Increases economic growth
Technological advancements, increased resources, or improved efficiency shift the PPF. This shift indicates a country’s economic health and growth.
4. Boosts productivity and unemployment
Some economies use PPF to enhance productivity and reduce unemployment. This helps bring more individuals into the workforce, increases wages, and increases the demand for goods.
Difference Between PPF and PPC
Economists often use PPF (Production Possibility Frontier) and PPC (Production Possibility Curve) interchangeably, but they assign slightly different meanings to each.
| Basis | PPF (Production Possibility Frontier) |
PPC (Production Possibility Curve) |
| Meaning | Represents the maximum attainable production limit of two goods with given resources | Shows the graphical curve that illustrates different production combinations |
| Nature | Conceptual boundary or frontier | Visual curve or line on a graph |
| Focus | Emphasizes limits, efficiency, and scarcity | Emphasizes trade-offs and opportunity cost |
| Representation | Acts as the outer limit of production possibilities | Drawn as a curve (concave or straight) representing choices |
| Efficiency Indicator | Points on the frontier show efficient production | Points on the curve show efficient combinations |
| Terminology Usage | Commonly used in modern economics textbooks | Older or alternative term still used in some contexts |
| Economic Insight | Highlights resource constraints and maximum output | Highlights allocation choices between two goods |
| Example | Maximum combinations of rice and wheat an economy can produce | Graph plotting rice on X-axis and wheat on Y-axis |
Final Thoughts
This production possibility frontier shows the maximum output a company can achieve with its limited resources and technology. The points on the curve are not fixed, and many factors can shift the curve either inwards (left side) or outwards (right side). Therefore, for a better economic future, a company must implement this model principle as a sustainable practice for resource allocation.
Frequently Asked Questions (FAQs)
Q1. Can the Production Possibility Frontier be a straight line?
Answer: Yes, the PPF can be a straight line when opportunity cost remains constant. This usually happens when the two goods are perfectly substitutable.
Q2. What does movement along the PPF represent?
Answer: Movement along the PPF represents a reallocation of resources between two goods, highlighting the trade-off and opportunity cost involved.
Q3. Can an economy operate beyond its PPF in the short run?
Answer: No, an economy cannot operate beyond its PPF with current resources and technology. It can only reach beyond the PPF through technological progress or resource growth.
Q4. Is PPF applicable only at the national level?
Answer: No, the PPF applies to individuals, firms, industries, and entire economies. Any decision involving limited resources and trade-offs can be analyzed using the PPF model.
Q5. Can the PPF shift for only one good?
Answer: Yes, if technology improves for only one good, the PPF shifts outward more on that axis, creating an asymmetric expansion.
Q6. How does economic growth reflect on the PPF?
Answer: Economic growth appears as an outward shift of the PPF, indicating increased production capacity due to better technology or more resources.
Recommended Articles
We hope this article on the “Production Possibility Frontier” was helpful. For more such economics-related articles, refer to the articles below.

