Updated March 15, 2023
Introduction to Power Spectral Density MATLAB
Power spectral density Matlab or PSD is used to show the strength of energy variations in terms of frequency.
PSD is used to detect the frequencies for stronger and weaker variations. PSD is measured in the unit (energy / frequency) or (variance / width).
It is used popularly if we want to understand the amplitudes & frequencies of signals (oscillatory) in our time series data. Using PSD, we can detect noise or unwanted vibrations and also locate the machines producing these unwanted noises.
MATLAB provides various functions to get the power spectral density, but it recommends ‘periodogram’ as the most suitable function for getting PSD. Therefore, let us discuss in detail how the periodogram function is used in MATLAB to get PSD.
Function 1: Power spectral density using periodogram function
Syntax
psd = periodogram (s)
Description of periodogram function:
psd = periodogram (s) will return the power spectral density estimate of the input signal, which is found using a rectangular window. Please note that the number of points in discrete Fourier transform will be either 256 or immediate next power of 2, whichever is greater than the length of the signal.
Examples of Power Spectral Density Matlab
Let us see how the code for periodogram function to get PSD looks like in MATLAB:
Example #1
a = 0 : 499;
[Defining number of samples as 500]
s = sin (pi / 2 * a) + randn (size (a));
[creating an input wave with an angular frequency of pi/2 radian/sample]
[psd] = periodogram (s);[Calling the periodogram function]
plot (10 * log10 (psd))
[Calling the plot function and using a logarithmic scale to get the output]
Input:
a = 0 : 499;

s = sin (pi / 2 * a) + randn (size (a));

[psd] = periodogram (s);

plot (10 * log10 (psd))
Output:
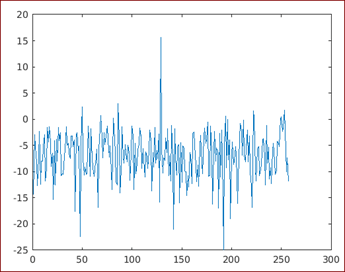
Please note that the power spectral density obtained in the above output will have a DFT length of 512 points (which is the immediate power of 2 greater than the length of the signal).
Example #2
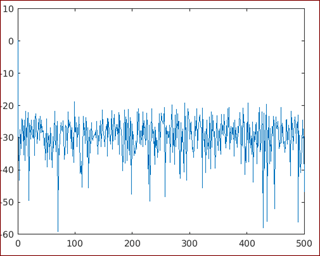
F = 1000
[Sampling the frequency]
a = 0:1/F:1-1/F;
[Defining the sample time]
x = cos (4 * pi /200 * a) + randn (size (a));
[Creating input wave with an angular frequency of 4pi/200 radian/sample]
[psd, w] = periodogram (x, [], length (x), F);[Calling the periodogram function]
plot (w, 10 * log10 (psd))
[Calling the plot function and using a logarithmic scale to get the output]
Input:
F = 1000

a = 0:1/F:1-1/F;

x = cos (4 * pi /200 * a) + randn (size (a));

[psd, w] = periodogram (x, [], length (x), F);

plot (w, 10 * log10 (psd))
Output:
We can also get power spectral density without using the ‘periodogram’ function.
Next, we will learn to create PSD using ‘Fourier transform.’
Syntax:
F = 600;
[Sampling the frequency]
T = 1 / F;
[Defining the sample time]
L = 3000;
[Defining the length of the signal]
a = (0 : L-1) * T;
[Defining the time vector]
s = cos (4 * pi / 200 * a) + randn (size (a));
[Creating input wave with an angular frequency of 4pi/200 radian/sample]
Ft = fft (s);
[Calling the Fourier transform function using input signal ‘s’]
Psd = 1 / (L * F) * abs (Ft (1 : length (s) / 2+1)).^3;
[Normalizing the signal]
fre = 0 : F/L : F/2;
[Setting the frequency]
plot (fre, 10 * log10 (Psd));
[Calling the plot function and using a logarithmic scale to get the output]
Input:
F = 600;

T = 1 / F;

L = 3000;

a = (0 : L-1) *  T;

s = cos (4 * pi / 200 * a) + randn (size (a));

Ft = fft (s);

Psd = 1 / (L * F) * abs (Ft (1 : length (s) / 2+1)).^3;

fre = 0 : F/L : F/2;

plot (fre, 10 * log10 (Psd));
Output:
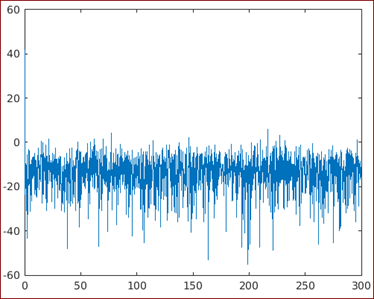
As we can see in the output, we have obtained the PSD using Fourier transform.
Conclusion
Power spectral density is mostly used to understand the amplitudes & frequencies of signals (oscillatory) in our time series data. MATLAB provides us with various functions like a periodogram to get PSD. Power spectral density can also be created using Fourier transform, as we learned in this article.
Recommended Articles
This is a guide to Power Spectral Density Matlab. Here we discuss the Examples of Power Spectral Density Matlab along with the input and output. You may also have a look at the following articles to learn more –
