Updated March 3, 2023
Introduction to Matlab xcorr
MATLAB’s xcorr method can be used to compute the cross-correlation of 2 time-sequences which are discrete in nature. The main aim of computing cross-correlation is to enable the use of a part of any incoming signal or beam to examine the transient evolution that is being produced by the second part. It can also be used to get the additional information of the incoming signal or beam itself which is otherwise tricky to measure.
Syntax:
- C = xcorr (a, b) is used to return the cross-correlation between two time sequences (discrete in nature).
- The method ‘xcorr’ will compute the similarity between vector ‘a’ & lagged copies of vector ‘b’
- C = xcorr (___, maximumlag) is used to limit the maximum lag as per the requirement
Let us now understand how to compute the cross-correlation in MATLAB using ‘xcorr’ method:
Examples of Matlab xcorr
Let us discuss examples of Matlab xcorr.
Example #1
In this example, we will use the xcorr method to compute the cross-correlation between 2 vectors. The steps to be followed for this example are:
- Create a vector ‘a’
- Create another vector ‘b’, with a shift of required units from ‘a’
- Pass the above 2 vectors as arguments to the xcorr method
- Use the stem method to plot the output
Code:
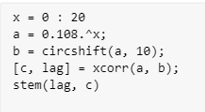
x = 0 : 20
[Initializing the size of the vector]
a = 0.108.^x;
[Initializing the vector ‘a’]
b = circshift(a, 10);
[Initializing the vector ‘b’. Here we have used ‘circshift’ method to get a vector which is shifted by 10 elements from ‘a’]
[c, lag] = xcorr(a, b);
[Using the xcorr method to get the cross correlation]
stem(lag, c)
[Using stem method to plot the output]
This is how our input and output will look like in Matlab command window:
Input:
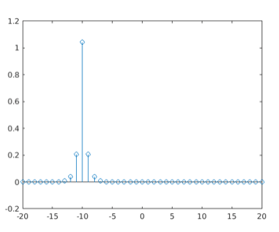
Output:
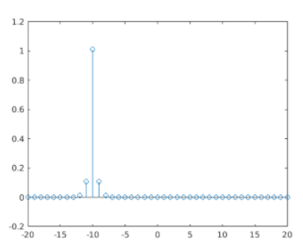
As we can see in the OUTPUT, largest spike comes at -10; i.e. when the elements of a & b match exactly, which is the same as expected by us.
Example #2
Let us take another example where we will use xcorr method to compute the cross-correlation between 2 vectors. The steps to be followed for this example are:
- Create a vector ‘a’
- Create another vector ‘b’, with a shift of required units from ‘a’
- Pass the above 2 vectors as arguments to the xcorr method
- Use the stem method to plot the output
Code:
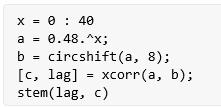
x = 0 : 40
[Initializing the size of the vector]
a = 0.48.^x;
[Initializing the vector ‘a’]
b = circshift(a, 8);
[Initializing the vector ‘b’. Here we have used ‘circshift’ method to get a vector which is shifted by 8 elements from ‘a’]
[c, lag] = xcorr(a, b);
[Using the xcorr method to get the cross correlation]
stem(lag, c)
[Using stem method to plot the output]
This is how our input and output will look like in Matlab command window:
Input:
Output:
As we can see in the OUTPUT, largest spike comes at -8; i.e. when the elements of a & b match exactly, which is the same as expected by us.
In the above 2 examples there was no limit on the lag. Next, we will learn how to define a lag in the xcorr method
Example #3
In this example, we will use xcorr method to compute the cross-correlation between 2 vectors and will limit the maximum lag. The steps to be followed for this example are:
- Create a vector ‘a’
- Create another vector ‘b’, with a shift of required units from ‘a’
- Pass the above 2 vectors as arguments to the xcorr method
- In addition to the above 2 arguments, pass a 3rd argument which will specify the maximum lag
- Use the stem method to plot the output
Code:
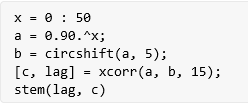
x = 0 : 50
[Initializing the size of the vector]
a = 0.90.^x;
[Initializing the vector ‘a’]
b = circshift(a, 5);
[Initializing the vector ‘b’. Here we have used ‘circshift’ method to get a vector which is shifted by 5 elements from ‘a’]
[c, lag] = xcorr(a, b, 15);
[Using the xcorr method to get the cross correlation. Please note that, we have passed a 3rd argument ‘15’, which represents the maximum lag that we need]
stem(lag, c)
[Using stem method to plot the output]
This is how our input and output will look like in Matlab command window:
Input:
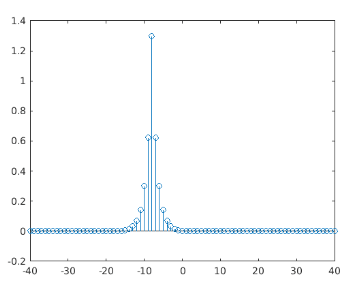
Output:
As we can see in the output, the signal is restricted with a maximum lag of 15 as expected by us.
Example #4
Let us take another example where we will use xcorr method to compute the cross-correlation between 2 vectors and will limit the maximum lag. The steps to be followed for this example are:
- Create a vector ‘a’
- Create another vector ‘b’, with a shift of required units from ‘a’
- Pass the above 2 vectors as arguments to the xcorr method
- Pass a 3rd argument which will specify the maximum lag
- Use the stem method to plot the output
Code:
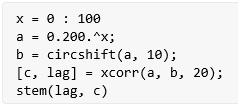
x = 0 : 100
[Initializing the size of the vector]
a = 0.200.^x;
[Initializing the vector ‘a’]
b = circshift(a, 10);
[Initializing the vector ‘b’. Here we have used ‘circshift’ method to get a vector which is shifted by 10 elements from ‘a’]
[c, lag] = xcorr(a, b, 20);
[Using the xcorr method to get the cross correlation. Please note that, we have passed a 3rd argument ‘20’, which represents the maximum lag that we need]
stem(lag, c)
[Using stem method to plot the output]
This is how our input and output will look like in Matlab command window:
Input:
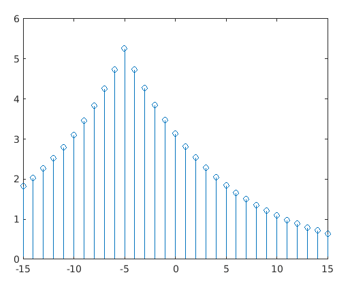
Output:
As we can see in the output, the signal is restricted with a maximum lag of 20 as expected by us
Conclusion
The xcorr method can be used in MATLAB to compute the cross-correlation of 2 time-sequences which are discrete in nature. If required, we can limit the maximum lag as per our requirement.
Recommended Articles
This is a guide to Matlab xcorr. Here we discuss the Introduction, How to compute the cross-correlation in Matlab along with the examples for better understanding. You may also have a look at the following articles to learn more –
