Updated July 5, 2023
Introduction to Parameters in Tableau
The variable that assumes no particular value but takes a value as passed or assigned by the user based on the context is termed a “parameter” in general. In Tableau, parameters are similar entities that take context-based values and offer dynamism to the user. Let us take an example. The senior management in an organization likes to see a certain number of top and bottom-performing regions in sales at the end of every month. Their dashboard has provided to visualize the first top ten performing regions. However, the management now feels that it is essential to have dynamic control for deeper analysis using any number of top performers to view over the dashboard. In Tableau, this can be achieved using “parameters.”
How to Create and Use Parameters in Tableau?
Now, we shall see how to create and use parameters step-by-step. Using parameters, we will display the requisite number of top-performing regions. For this example, we will use data with multiple fields. Each field has a significance of its own. For our purpose, the fields of interest are Region and Quantity. The region is a categorical variable, while quantity is a numerical variable.
Below are the steps to create and use Parameters.
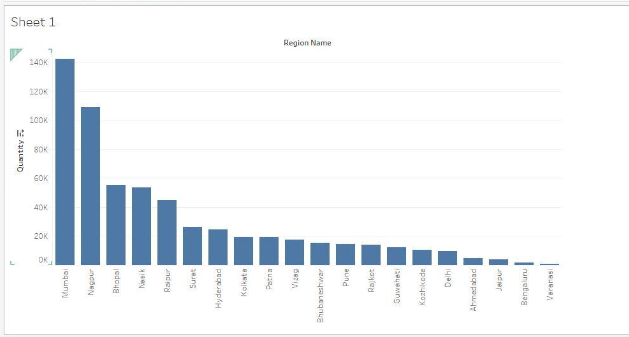
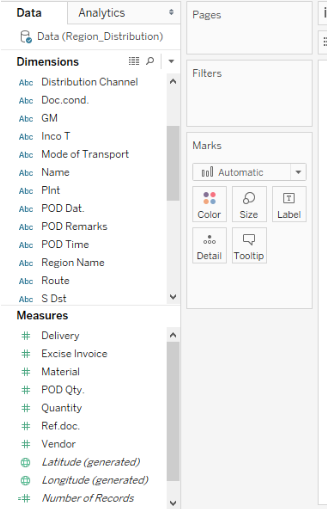
Step 1: First, we shall have the requisite data loaded in Tableau, as shown below:
Step 2: In this step, we will understand the initial few aspects of Parameters.
Click on this button. It will pop up various options.
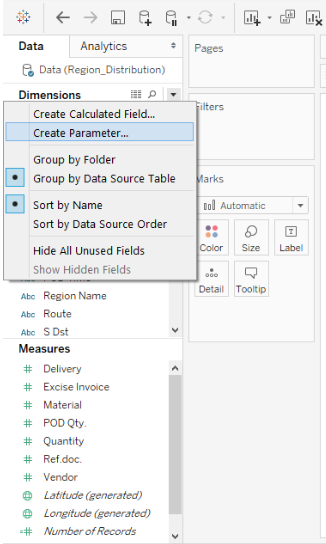
Clicking on the button will generate a list of menus. Click on the “Create Parameter…” option from the list.
Step 3: Clicking on the “Create Parameter…” option as in the above step will generate a dialogue box, as shown below:
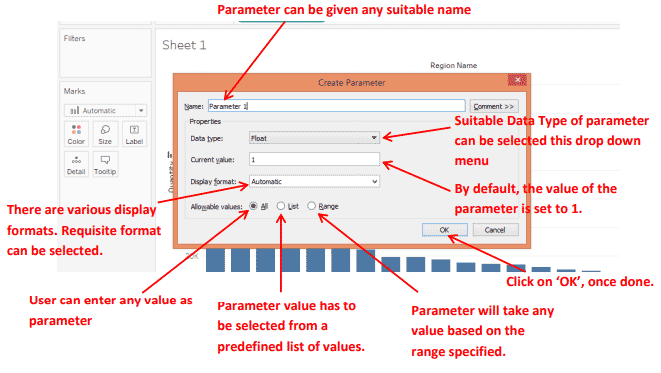
Step 4: In this step, we shall create the actual parameter. We have provided the name for the parameter.

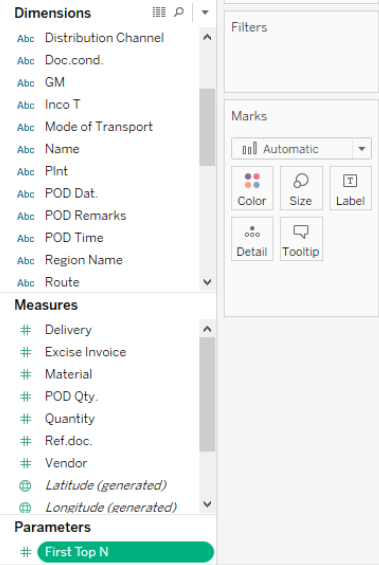
A newly created parameter appears in the lower-left corner of the window. It appears under the “Parameters” section below the “Measures.” It is highlighted for easy notice. We will use this parameter in the filter to serve our purpose.
Step 5: In this step, we will create a filter over the categorical variable, i.e., Region Name.
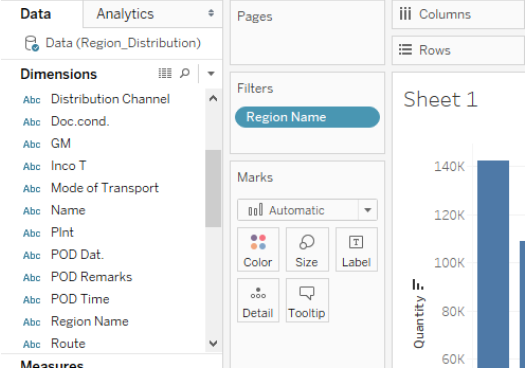
We have created a filter over the “Region Name” field by bringing the dimension in the “Filters.”
Section. Next, we will use the parameter “First Top N” created in the filter’s previous part.
Step 6: Edit the filter to use a parameter with it.
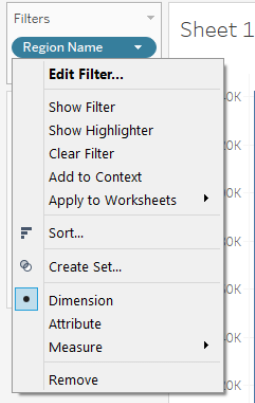
Clicking on the button will generate various options. Click on the “Edit Filter” option. It will generate a dialogue box with multiple options.
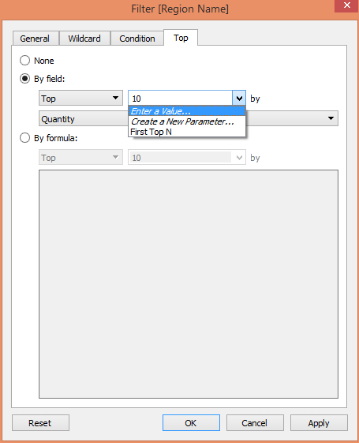
In the dialogue box, click on the “Top” tab. By default, “None” is selected. Click on “By field.” Clicking on “By field.”
Activates these options. Here the default value is 10. Notice the parameters that we created appeared on the list. Click on that and select it.
The parameter that we created has been selected.
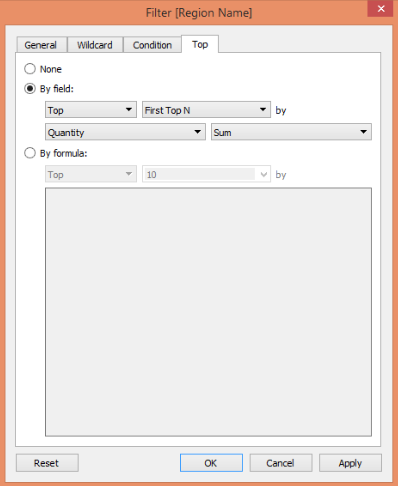
Here there are two options: Top and Bottom. Selecting the top will output Top performers based on “Quantity” using the “First Top N” parameter. Selecting Bottom shall do the reverse. Finally, Click on “Apply” and then on “OK.”
Step 7: We will make the parameter visible on the window, without which it won’t be possible to use it.
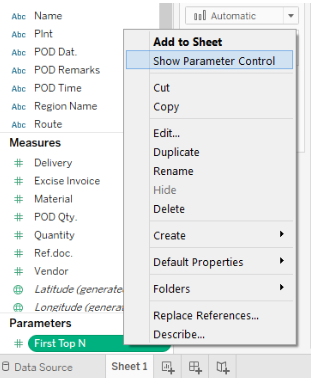
Select the “Show Parameter Control” option from the list. It will make the parameter visible on the screen. Right-Clicking on the parameter will generate a list of menus.
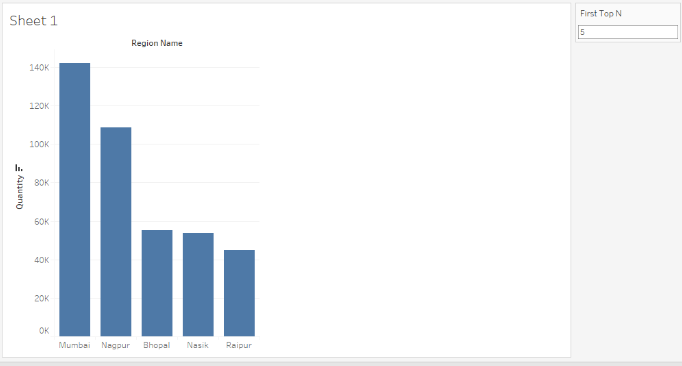
Clicking on “Show Parameter Control” makes the parameter visible. Remember, we had set the default value to 5 while creating the parameter. The graph now has only 5 bars corresponding to the first 5 top performing regions.
Step 8: Validating and using the parameter, experimenting with multiple values.

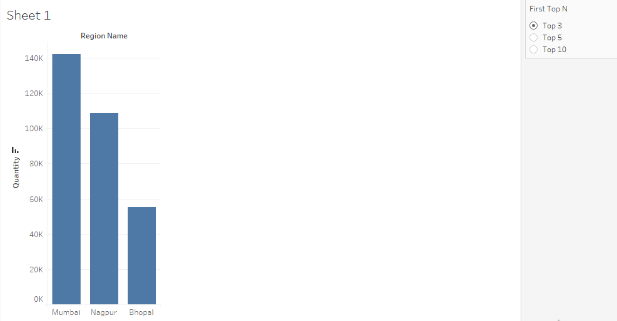
Entering ‘3’ here has given us the first top 3 performing regions regarding quantity sold. The top three performing regions were generated after we entered the requisite parameter value. Parameters enable real-time value assignment and facilitate dynamism to the user.
In the above part, we learned to create and use the parameter. In this case, we allowed the parameter to take any value by selecting “All” in “Allowable values.” Now, we will try to explore the other two options, viz. List and Range.
Allowable values as a list
Right Click on the parameter and click on “Edit…” as shown:
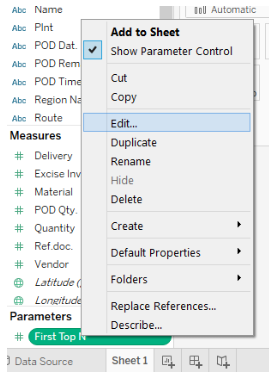
Click on “Edit…”. It will generate the Edit Parameter dialogue box.
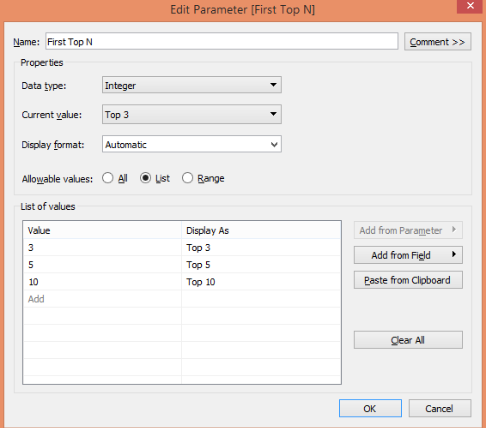
Select the “List” option. In the “List of Values” section, we created a list containing values 3, 5, and 10 with Top 3, 5, and Top 10 as their respective names. Once done, click on ‘OK.’
See how the list appears now. It appears as a list. Now parameter can only take a value amongst those specified in the list. It will display the result accordingly.
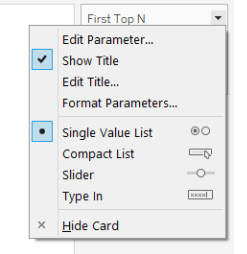
Click on the parameter to explore various options. We can change how we want to display the list by selecting a suitable option.
Allowable values as Range
Again, edit the parameter mentioned in the above section and perform the requisite changes.
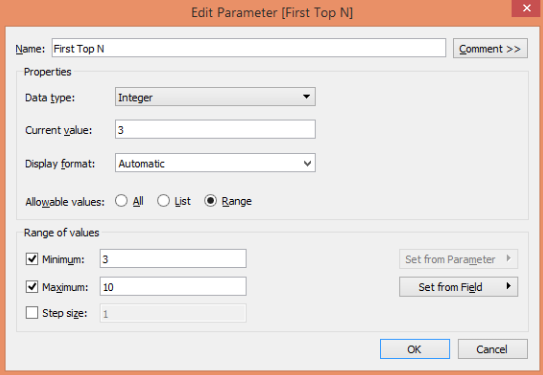
Select the “Range” option. Set the minimum and maximum values. We have set the minimum value to 3 and the maximum to 10. Click OK; once done
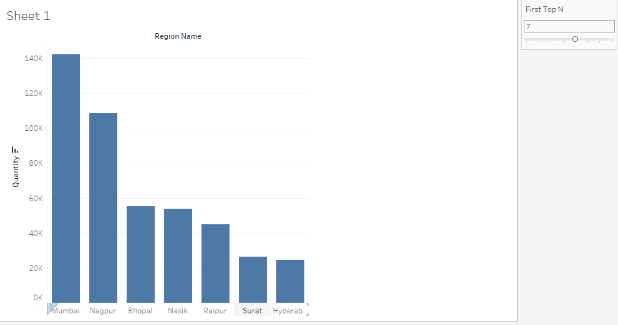
Now, the parameter appears as a slider that can take values ranging from 3 to 10. We have selected 7 as the
parameter value, as a result of which we got the top 7 performers in the output.
Conclusion – Parameters in Tableau
Parameters are dynamic entities that add tremendous value to Tableau as a functionality. They can be used in multiple ways based on the context. The basic idea underlying parameters in Tableau remains the same as any parameter in general: they are not constant but assume any value assigned to them in real time.
Recommended Article
This is a Guide to Parameters in Tableau. Here we discuss the Introduction to parameters in Tableau and how to Create and Use parameters, respectively. You can also go through our other suggested articles to learn more –
