Updated September 1, 2023
Table of Contents
What is a Matlab Table?
The ‘Table’ function is used in Matlab to create the table. A table can contain different type’s data or information, such as variables, values, constants, etc. It also has different sizes as long as all variables. The table function arranges the data into rows and columns as we define.
Syntax
- T = table(var1,…,varN)
- T = table(___,’VariableNames’,varNames)
- T = table(___,’RowNames’,rowNames)
How to Create a Table in Matlab?
The Table function is used for creating the table. A table can contain different types of data and sizes. So, we must take all that data and create a table of different sizes and types. To create a table, the following steps are used.
Step 1: Read all the data from the file.
Step 2: Assign all data to a variable.
Step 3: Then, use the appropriate syntax of the ‘Matlab Table’ function to create a table.
Step 4: Then execute the code.
Examples of Matlab Table
Here are the following examples mentioned below
Example #1
Let us consider an example of a Table. In this example, we can see how to create a table using the Table function. We have data on the sale of fruits in five shops. We can create a table by using the Table function. First, we take all sell entries per fruit name and then make a table using the Table function. Variable names taken are Mango, coconut, Banana, and Apple. [8; 4; 3; 10; 9] This data is assigned to the variable Mango. A variable coconut contains [8; 4; 3; 10; 9] data. [11; 16; 14; 17; 14] that data is assigned to the variable Banana. A variable Apple contains [76; 63; 31; 33; 19] data. All this data is the number of fruit boxes sold in 5 shops. All appropriate data is loaded into the table, and a table will be created with the help of the Table function. The table function arranges all data into rows and columns as we define. Execute the code to create data.
Code
clc;
clear all;
close all;
Mango = [8;4;3;10;9];
coconut = [8;4;3;10;9];
Banana = [11;16;14;17;14];
Apple = [76; 63; 31; 33; 19];
Shops = [ 'X'; 'Y' ; 'F'; 'J'; 'E'; ];
T = table(Shops, Mango, coconut, Banana, Apple)
Output
Command Window:
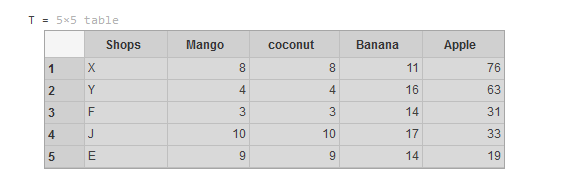
After executing the code, a table is created in the command window.
This table represents data related to different shops, including the quantities of fruits they have in stock: “Mango,” “coconut,” “Banana,” and “Apple.” The “Shops” column lists the shop names. The table function uses arrays corresponding to the columns in the table to construct it.
Example #2
Let us consider one more example of Table. We have data on specific company’s products and their transport places. As we know, we used the Table function to create a table in Matlab. In this example, we can see another type to create a table. We can assign all the data using the ‘Matlab table’ function in this example. We use the table function with proper syntax to create a table. “T = table ( categorical ( {‘D’;’ C’; ‘B’} ), [16;32;8], …{‘XY’; ‘YZ’;’ AB’}, … VariableNames’, {‘Product_Name’, ‘Quantity’, ‘State’})” this line has created a table using provide data and variables. Here, variable Names are ‘Product Name’, ‘Quantity’, and ‘State’. The table function arranges all data into rows and columns as we define. After executing, the code table will be created.
Code
clc;
clear all;
close all;
T = table(categorical({'D';'C';'B'}),[16;32;8],...
{'XY';'YZ';'AB'},...
'VariableNames',{'Product_Name','Quantity','State'})
Output
Command Window:
We take all the data in the first example and then use the Table function.
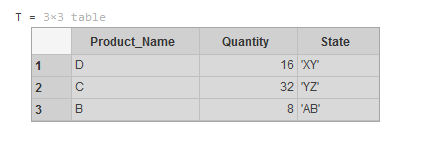
The provided code snippet uses MATLAB to create a table named ‘T’ with three columns: ‘Product_Name’, ‘Quantity’, and ‘State’. The first column contains categorical data (‘D’, ‘C’, ‘B’), the second column holds numerical values (16, 32, 8), and the third column stores character data (‘XY’, ‘YZ’, ‘AB’). The ‘VariableNames’ property assigns names to the columns. The commands at the beginning (clc, clear all, close all) respectively clear the command window, workspace, and all open figures.
Example #3
Let us see one more example of the table. This example shows how to specify row names while creating a table in Matlab. As we know, the Matlab’ table’ function is used for creating the table. So, we use the table function to specify row names while creating a table in Matlab. So, we first take all the data into variables. We have some data related to persons, like their age, height, and weight. So first, we take all that data into variables. Age, Weight, Height, and Name are variables to contain all the data. Now, we use the table function with proper syntax for creating a table. The table function arranges all data into rows and columns as we define. After executing, the code table will be created.
Code
clc;
clear all;
close all;
Name = {'A';'B';'C';'D';'E'};
Age = [18;19;16;17;18];
Height = [71;69;64;67;64];
Weight = [55;63;56;49;59];
T = table(Age,Weight,Height,'RowNames',Name)
Output
Command Window:
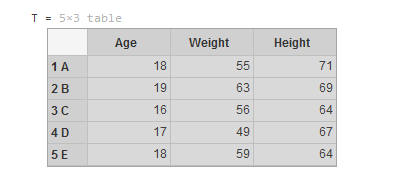
In this MATLAB code snippet, the clc, clear all, and close all commands respectively clear the command window, remove all workspace variables, and close all figures. Arrays “Name,” “Age,” “Height,” and “Weight” are defined. A table “T” is created using these arrays as columns, with “RowNames” set to “Name” array values as identifiers for rows.
Conclusion
In conclusion, MATLAB’s table data structure offers a powerful and intuitive way to manage and analyze data. Its ability to store mixed data types, perform indexing, and integrate seamlessly with other MATLAB functions makes it an essential tool for data manipulation tasks. Whether for scientific research or engineering applications, MATLAB tables enhance efficiency and simplify data handling.
FAQs
Q1. What is a MATLAB table, and what can you do with it?
Ans: A MATLAB table is a helpful tool for organizing data in a two-dimensional format, with rows and named columns. It can store and manage various data types, such as numbers, strings, and logical values, in a structured way. With MATLAB tables, you can perform operations like data indexing, filtering, sorting, grouping, and statistical analysis, which makes them great for data manipulation and analysis tasks.
Q2. How to read tables in MATLAB?
Ans: You can use the “readtable” function to read tables in MATLAB. Provide the path to the table file or the data; the function will create a table variable. You can specify various options like delimiter, variable names, and data types. Once read, you can manipulate and analyze the data using table-specific functions and syntax in MATLAB.
Q3. How can I make a table in MATLAB?
Ans: You can use the built-in table function to create a table in MATLAB. Define your variables as arrays or column vectors, and then use the function to combine them into a table. For example:
% Define data
name = {'Alice'; 'Bob'; 'Charlie'};
age = [25; 30; 28];
height = [165; 180; 172];
% Create a table
data_table = table(name, age, height);
% Display the table
disp(data_table);
This code snippet creates a table named data_table with columns’ name’, ‘age’, and ‘height’. Adjust variable names and data as needed.
Recommended Articles
We hope that this EDUCBA information on the “Matlab Table” was beneficial to you. You can view EDUCBA’s recommended articles for more information.
