Updated March 13, 2023
Introduction to Matlab regression
A MATLAB Regression function is used to find the relationship between two variables by putting a linear equation to the observed data. One variable is considered as an explanatory variable and another variable is considered as a dependent variable. The dependent variable is continuous in nature. The dependent variable means variable values are focused or explained and the other hand explanatory variable or independent variable is used to focus on the dependent variable. The dependent variable is denoted as Y and the explanatory variable or independent variable is denoted as X. For a multiple linear regression of the responses in the vector of the explanatory variable on the predictors in the matrix of independent variable Matlab Regression function is used.
Syntax
The syntax for MATLAB Regression function is as follow: –
b = regress(y,X)
How does Regression work in Matlab?
A MATLAB Regression function is used to find the relationship between two variables by putting a linear equation to the observed data. There are two variables one is the explanatory or independent variable and another variable is the dependent variable. The dependent variable is continuous in nature. There are very simple steps for knowing how regression function works in Matlab and the steps are as follows; –
Steps 1: Create one variable as an explanatory or independent variable and load all input
data.
Steps 2: Create one more variable as a dependent variable and load the all data.
Steps 3: Then write the equation which can be including the slope of the line.
Steps 4: Then use MATLAB Regression function with proper syntax
Steps 5: Execute the Matlab code to get the output.
Examples of Matlab regression
Here are the following examples mention below
Example #1
Let us see the example of Matlab regression and how it works in Matlab. As we know for the regression process in Matlab we used the MATLAB Regression function. So let assume the number of observation is 100. Then we create the artificial noise using the rand function. “noise = randn(n,1);” this line is used to create the artificial noise. After that we create the independent variable x. “x=rand(n,1).*10;” this line creates the independent variable x which is artificially enlarged than noise. After that we ready to write the equation. “y= 2+3.5*x+noise;” this line gives the equation, here 3.5 is the slope of independent variable x. And we add the artificial noise in this equation. Then we plot the graph using the plot function between independent variable x and dependent variable y. After that, we used “lsline” syntax for creating a line or plotting the line. After that, we create the first beta values by attaching the ones. By using “X= [ones(size(x)) x];” this line we create the first beta values and then finally we create the final beta by using the MATLAB Ra egression function. “beta = regress(y, X)” this syntax creates the beta. So after executing the Matlab code we get 2 beta values.
Code:
clc;

clear all;

close all;

n =100;

noise = randn(n,1);

x=rand(n,1).*10;

y= 2+3.5*x+noise;

plot(y,x,'.')

lsline

X= [ones(size(x)) x];

beta = regress(y,X)
Output:
Command window:
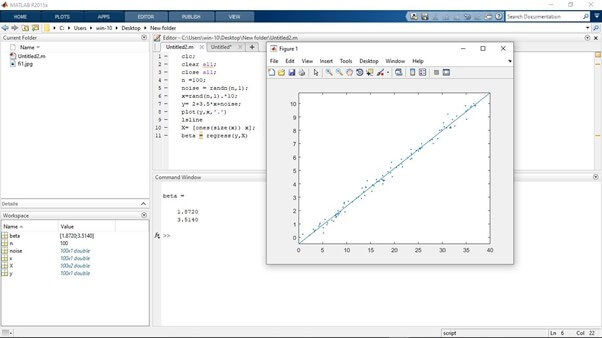
Figure 1
After executing the Matlab code we get regression values using the regression function.
Example #2
Let us see one more example of regression. As we know to find regression in Matlab we used the MATLAB Regression function. In this example, we see that the efficient way of regression function in Matlab. Here a large number of observations is assumed. So let assume the number of observation is equal to 1000. Then the artificial noise is created using the ‘randn’ function “noise = randn(n,1);” this line is used to create the artificial noise in Matlab. Then we create an independent variable and a dependent variable. For creating the independent variable A
“A=rand(n,1).*9;” this line is used. After that we ready to write the equation “B= 1+3.5*A+noise;”, this line gives the equation, here 3.5 is the slope of independent variable A. And we add the artificial noise in this equation. Then we plot the graph using the plot function between independent variable A and dependent variable B. After that, we used “lsline” syntax for creating a line or plotting the line. After that, we create the first beta values by attaching the ones. By using “X= [ones(size(A))A];” this line we create the first beta values and creates finally we create the final beta by using the MATLAB Regression function. “beta = regress(B,X)” this syntax creates the beta. So after executing the Matlab code we get 2 beta values.
Code:
clc;

clear all;

close all;

n =1000;

noise = randn(n,1);

A=rand(n,1).*9;

B= 1+3.5*A+noise;

plot(B,A,'.')

lsline

X= [ones(size(A)) A];

beta = regress(B,X)
Output:
Command window:
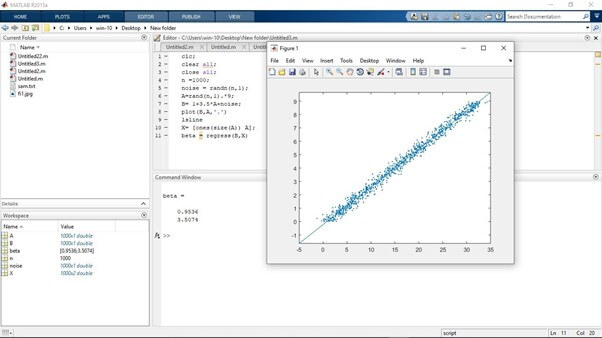
Figure 2
After executing the Matlab code we get regression values using the regression function.
Conclusion
In this article, we saw the concept of the Regression function. Basically, the Regression function is used to find the relationship between two variables by putting a linear equation to the observed data. Then saw syntax related to the Regression function and how it’s used in Matlab code. Also, we saw how important a role played by MATLAB Regression function in the regression process.
Recommended Articles
This is a guide to Matlab regression. Here we discuss How does Regression works in Matlab and Examples along with the codes and outputs. You may also have a look at the following articles to learn more –
