EDUCBA

EDUCBA

MENUMENU
  • Free Tutorials
  • Free Courses
  • Certification Courses
  • 360+ Courses All in One Bundle
  • Login
Home Data Science Data Science Tutorials Matlab Tutorial Matlab Plot Marker
Secondary Sidebar
Matlab Tutorial
  • Advanced
    • MATLAB Class
    • Arrays in MATLAB
    • Matlab find value in array
    • MATLAB Grader
    • Power Spectral Density MATLAB
    • Matlab Textscan
    • String Array in MATLAB
    • MATLAB Random Numbers
    • Matlab Dot
    • MATLAB 2D Array
    • MATLAB? zero padding
    • MATLAB sort matrix
    • MATLAB Plot Function
    • 2D Plots in MATLAB
    • 3D Plots in MATLAB
    • MATLAB Fread
    • Spectrogram MATLAB
    • MATLAB Average
    • MATLAB exponent
    • MATLAB not enough input arguments
    • MATLAB comment
    • MATLAB zpk
    • Scatter Plots in MATLAB
    • MATLAB 3d scatter plot
    • Bar Graph in MATLAB
    • Bar Plot MATLAB
    • Log Plot MATLAB
    • Polar Plot in MATLAB
    • Surface Plot in MATLAB
    • MATLAB Plot Circle
    • Boxplot in MATLAB
    • MATLAB Plot Multiple Lines
    • Linspace MATLAB
    • Histogram in MATLAB
    • Plot Vector MATLAB
    • MATLAB Legend
    • MATLAB Plot Legend
    • MATLAB ezplots
    • Column Vector MATLAB
    • MATLAB Plot Marker
    • MATLAB LineWidth
    • MATLAB Line Style
    • Contour plot in MATLAB
    • MATLAB Sine Wave
    • Reshape in MATLAB
    • Natural Log in MATLAB
    • Random Number Generator in MATLAB
    • Complex Numbers in MATLAB
    • MATLAB Figure
    • Heatmap in MATLAB
    • MATLAB Technical Computing
    • Colors in MATLAB
    • Colormap in MATLAB
    • MATLAB Plot Colors
    • MATLAB fplot()
    • MATLAB Stacked Bar
    • MATLAB sphere()
    • MATLAB cylinder()
    • MATLAB mesh()
    • Pie Chart in MATLAB
    • MATLAB Gradient
    • Grid on MATLAB
    • Repmat in MATLAB
    • dlmread in MATLAB
    • Meshgrid in MATLAB
    • MATLAB Struct
    • MATLAB Cross Product
    • MATLAB colorbar Label
    • MATLAB Save Variable
    • MATLAB Saveas
    • MATLAB Cell Array
    • Polynomial in MATLAB
    • ismember MATLAB
    • Heaviside MATLAB
    • MATLAB rref
    • MATLAB polyfit()
    • MATLAB xlim
    • MATLAB Variance
    • Optimset MATLAB
    • Quiver MATLAB
    • Newton Raphson MATLAB
    • Mat2cell MATLAB
    • Magnitude MATLAB
    • format long MATLAB
    • Dot Product MATLAB
    • Jacobian MATLAB
    • What is Matlab?
    • Convolution MATLAB
    • Moving Average MATLAB
    • Fourier Series MATLAB
    • Gaussian Fit MATLAB
    • Bisection Method MATLAB
    • Laplace Transform MATLAB
    • Fourier Transform MATLAB
    • Signal Processing MATLAB
    • MATLAB Forms
    • Complex Conjugate MATLAB
    • MATLAB Write to File
    • uigetfile MATLAB
    • MATLAB Toolbox
    • MATLAB Errorbar
    • MATLAB Index Exceeds Matrix Dimensions
    • Nyquist MATLAB
    • Impulse Response MATLAB
    • xlsread MATLAB
    • MATLAB xlswrite
    • Matplotlib Scatter
    • MATLAB Import Data
    • MATLAB Export Data
    • MATLAB Read CSV
  • Basic
    • MATLAB Area Under Curve
    • MATLAB not equal
    • MATLAB max
    • MATLAB exist
    • MATLAB Table
    • MATLAB regression
    • MATLAB Lists
    • MATLAB quantile
    • MATLAB Round
    • MATLAB readtable
    • MATLAB disp
    • MATLAB Standard Deviation
    • MATLAB quadprog
    • MATLAB Transpose
    • Introduction to MATLAB
    • Advantages of MATLAB
    • MATLAB Features
    • Taylor Series MATLAB
    • MATLAB Z Transform
    • fsolve in MATLAB
    • MATLAB QR
    • Career in MATLAB
    • Uses Of MATLAB
    • MATLAB Free
    • How to Install MATLAB
    • How to Use MATLAB?
    • MATLAB Version
    • MATLAB Compiler
    • MATLAB Commands
    • MATLAB Block Comment
    • MATLAB? sprintf
    • MATLAB fprintf
    • Data Types in MATLAB
    • MATLAB Integral
    • MATLAB Double Integral
    • MATLAB boolean
    • MATLAB vpa
    • MATLAB Object
    • MATLAB Annotation
    • MATLAB Variables
    • MATLAB Global Variables
    • MATLAB Operators
    • MATLAB Logical Operators
    • MATLAB nan
    • MATLAB Patch
    • MATLAB AND Operator
    • MATLAB OR Operator
    • Vectors in MATLAB
    • What is Simulink in MATLAB
    • MATLAB Interpolation
    • MATLAB Imread
    • fscanf MATLAB
    • Euler Method MATLAB
    • Root Locus MATLAB
    • MATLAB return
    • Bode Plot MATLAB
    • Nargin MATLAB
    • MATLAB Matrix Inverse
    • MATLAB String to Number
    • MATLAB string
    • MATLAB ColorBar
    • MATLAB Surfc
    • MATLAB Concatenate
    • NUMEL MATLAB
    • MATLAB? File Extension
    • MATLAB File
    • MATLAB Smooth
    • MATLAB ones
    • Exponential in MATLAB
    • MATLAB ksdensity
    • MATLAB log
    • MATLAB Append
    • MATLAB hold on
    • MATLAB Magnitude of Vector
    • Heatmap in MATLAB
    • MATLAB xticks
    • MATLAB randn
  • Control Statements
    • IF-Else Statement in MATLAB
    • If Statement in MATLAB
    • Loops in MATLAB
    • For Loop in MATLAB
    • While Loop in MATLAB
    • do while loop in MATLAB
    • Nested Loop in MATLAB
    • Switch Statement in MATLAB
    • Break in MATLAB
  • Functions
    • MATLAB Functions
    • MATLAB user defined function
    • Calling Functions in MATLAB
    • Transfer Functions in MATLAB
    • Anonymous Functions in MATLAB
    • Inline Functions in MATLAB
    • Bessel Functions in MATLAB
    • Mean Function in MATLAB
    • Find Function MATLAB
    • Filter Function in MATLAB
    • IIR Filter MATLAB
    • Piecewise Function in MATLAB
    • Sum Function in MATLAB
    • Simulink MATLAB Function
    • MATLAB Create Function
    • MATLAB Inverse Function
    • MATLAB Count
    • Step Function MATLAB
    • MATLAB limit
    • Fminsearch in MATLAB
    • Covariance in MATLAB
    • Summation in MATLAB
    • Linear Fit MATLAB
    • MATLAB?linear regression
    • MATLAB Derivative
    • MATLAB Derivative of Function
    • MATLAB Comet()
    • Fzero MATLAB
    • xlabel MATLAB
    • Matplotlib Legend
    • Matplotlib Subplots
    • Plot graph MATLAB
    • MATLAB Format
    • MATLAB plot title
    • Multiple Plots in MATLAB
    • MATLAB Indexing
    • Ceil MATLAB
    • Curve Fitting MATLAB
    • MATLAB trapz()
    • MATLAB Normalize
    • MATLAB diff
    • MATLAB sym()
    • MATLAB Syms
    • Absolute Value MATLAB
    • MATLAB Exponential
    • Kalman Filter MATLAB
    • Low Pass Filter MATLAB
    • Bandpass Filter MATLAB
    • MATLAB Unique
    • Trapezoidal Rule MATLAB
    • MATLAB Root Finding
    • MATLAB stem()
    • MATLAB loglog()
    • MATLAB Autocorrelation
    • MATLAB Sort
    • Simplify MATLAB
    • Cumsum MATLAB
    • Eval Function MATLAB
    • Polyval MATLAB
    • MATLAB Colon
    • MATLAB Eigenvalues
    • MATLAB fit
    • Delta Function MATLAB
    • MATLAB Remainder
    • Differentiation in MATLAB
    • Permute MATLAB
    • isempty MATLAB
    • MATLAB text()
    • MATLAB Display Text
    • Varargin in MATLAB
    • MATLAB gca
    • MATLAB fill()
    • MATLAB pcolor()
    • MATLAB min
    • MATLAB xcorr
    • MATLAB? color codes
    • Semilogy MATLAB
    • MATLAB? eye
    • feval MATLAB
    • num2str in MATLAB
    • MATLAB Images
    • MATLAB Image? Segmentation
    • Imagesc MATLAB
    • MATLAB Image Processing
    • MATLAB Image Resize
    • MATLAB Flag
    • MATLAB fopen
    • Strcmp MATLAB
    • MATLAB fwrite
    • MATLAB fft()
    • MATLAB zeros()
    • MATLAB textread
    • Arctan MATLAB
    • MATLAB Scripts
    • Butterworth filter MATLAB
    • MATLAB Findpeaks
    • MATLAB find Index
    • MATLAB Cell
    • MATLAB Unit Step Function
    • MATLAB Backslash
    • MATLAB Mod
    • Size Function in MATLAB
    • Secant MATLAB
  • Matrix
    • Matrix in MATLAB
    • 3D Matrix in MATLAB
    • Transpose Matrix MATLAB
    • Sparse Matrix in MATLAB
    • Matrix Multiplication in MATLAB
    • Identity Matrix in MATLAB
    • MATLAB?writematrix
  • Programs
    • Square Root in MATLAB
    • Square Wave MATLAB
    • Squeeze MATLAB
    • Factorial in MATLAB
    • Cell to String MATLAB
  • Interview Questions
    • MATLAB Interview Questions

Related Courses

MATLAB Certification Course

R Programming Course

All in One Data Science Courses

Matlab Plot Marker

By Priya PedamkarPriya Pedamkar

Matlab Plot Marker

Introduction to Matlab Plot Marker

Plots are used to have the knowledge in a particular topic without having any background knowledge about the performance of variables. They are very helpful to the uninformed audience to take decisions. There are many types of plots that are used depending on business requirements. They can be a bar plot, line plot, scatter plot, etc. Markers are used in the plot to identify the differences between the lines or highlight some of the relevant points in the line that are required during the analysis in the respective area.

Working of Matlab Marker in Plots

Markers in the plot can be used for many reasons like highlighting some of the important points which are required for the analysis or to distinguish between different points so that they can plot them with different prints and patterns. We can use this property while mentioning it in the input argument using different marker properties.

Syntax:

plot (a, b,’ name of the property’, ‘value’)

Start Your Free Data Science Course

Hadoop, Data Science, Statistics & others

All in One Data Science Bundle(360+ Courses, 50+ projects)
Python TutorialMachine LearningAWSArtificial Intelligence
TableauR ProgrammingPowerBIDeep Learning
Price
View Courses
360+ Online Courses | 50+ projects | 1500+ Hours | Verifiable Certificates | Lifetime Access
4.7 (86,650 ratings)

Here a and b are the inputs that we specify while plotting any graph. Generally, we use Marker to plot the line graphs using a name-value pair where we can draw the graph using plot () function in Matlab.

Examples of Matlab Plot Marker

Given below are the examples of matlab plot marker:

Example #1

a = linspace (0,5,10);
b= a*2+sin(2*a);
plot (a, b,’-o’)

Output:

matlab plot maker 1

This will plot a line graph with all the points marked in a circle format, which is usually known as circle markers. If we specify no line in the command, then the output will be in the form of markers only, without displaying any line which is required to connect the points.

Example #2

a = linspace (0,5,10);
b= a*2+sin(2*a);
plot (a, b,’o’);

Output:

matlab plot marker 2

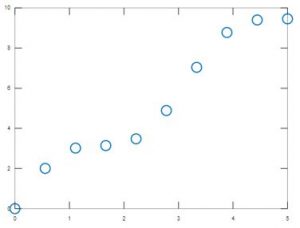
We can specify the marker size and color to show the placement of markers. We can change these properties using the name-value pairs depicting the property of the marker and the required value of the respective property. Marker Size is the property that is used to specify the size of points and it is always a positive value. Marker edge color is the property that is used to specify the color that we want to mark the outline of the graph. Each color has its own unique RGB triplet value which can be mentioned in the argument also.

We can also mention the color name in the input argument for the changes in the plot. Marker Face Color is used for the inside color that we want to give in the plot. This property can also be specified in the input argument using the color name or RGB triplet value. Marker colors can be red, blue, green, cyan, Magenta, Yellow, Black, and White. We can also see the property of the line by specifying the necessary symbol along with the marker sign or shape like ‘- ‘is the solid line which is the default line, ‘— ‘is the dashed line,’:’ is the dotted line and ‘-.’ Is the dashed-dotted line.

Example #3

a = linspace (0,5,10);
b= a*2+sin(2*x);
plot (a, b,'-s','MarkerSize',5, ...
'MarkerEdgeColor','blue’, ...
'MarkerFaceColor',[1 .4 .4])

Output:

Example 3

In the above example, we have used all the three properties which we have discussed in the above paragraph. Marker size we have given as 5, Marker edge color as blue and the last property Marker Face color we have specified using the RGB triplet value. Based on the intensities we want, we can decide the RGB triplet value and mention it in the command for the desired results.

We can also control the placement of the markers depending on the requirements so that we can display the markers only in certain data points as mentioned in the input argument. This can be achieved by using Marker Indices property in Matlab which helps in the distribution of markers in the relevant data points. For example: If we want to display the marker in every 5th data point which starts from the first data point then we can give it as input to the command which will show the marker only in the respective position. We can also display the maximum and minimum points in the line graph by specifying it in the Marker Indices property. Please find the below example explaining the above property.

In the above example, we have applied to find function to find the minimum and maximum value in the input which has a function and then applied those variables in the Marker Indices property to denote only the maximum and minimum points. We can also change the location of the marker to its default position if we want to revert any changes. This can also be achieved by using the Marker Indices property in Matlab by describing the length of the variable used from the starting point of the plot.

There are different Marker Symbols which are used while plotting the line graphs and are supported in Matlab like ‘o’ is used to denote the circle markers,’*’ is known as asterisk marker,’.’ Is known as point marker,’+’ is known as plus marker,’x’ is known as cross marker,’s’ is known as square marker, ’d’ is known as diamond marker,’^’ is known as upward triangle marker,’v’ is the downward triangle,’>’ is known as triangle pointing right,’<’ is known as triangle pointing left, ’p’ is the pentagram market which has five-pointed star, ’h’ is the hexagram market which has six-pointed star and none is for no marker point.

Conclusion

Marker plots are used in Matlab which are used in plotting the line graphs and scatter plots which help us to distinguish various data points in several conditions. They are used in business analysis to understand the spread of the data or understand several properties related to the data points across the variables.

Recommended Articles

This has been a guide to Matlab Plot Marker. Here we discuss the introduction, working, syntax, and different examples of Matlab Plot Marker. You may also have a look at the following articles to learn more –

  1. 3D Plots in Matlab
  2. Heatmap in MATLAB
  3.  Matlab Free
  4. Matlab Logical Operators
Popular Course in this category
MATLAB Training (3 Courses, 1 Project)
  3 Online Courses |  1 Hands-on Project |  8+ Hours |  Verifiable Certificate of Completion
4.5
Price

View Course

Related Courses

R Programming Training (13 Courses, 20+ Projects)4.9
All in One Data Science Bundle (360+ Courses, 50+ projects)4.8
0 Shares
Share
Tweet
Share
Primary Sidebar
Footer
About Us
  • Blog
  • Who is EDUCBA?
  • Sign Up
  • Live Classes
  • Corporate Training
  • Certificate from Top Institutions
  • Contact Us
  • Verifiable Certificate
  • Reviews
  • Terms and Conditions
  • Privacy Policy
  •  
Apps
  • iPhone & iPad
  • Android
Resources
  • Free Courses
  • Database Management
  • Machine Learning
  • All Tutorials
Certification Courses
  • All Courses
  • Data Science Course - All in One Bundle
  • Machine Learning Course
  • Hadoop Certification Training
  • Cloud Computing Training Course
  • R Programming Course
  • AWS Training Course
  • SAS Training Course

ISO 10004:2018 & ISO 9001:2015 Certified

© 2022 - EDUCBA. ALL RIGHTS RESERVED. THE CERTIFICATION NAMES ARE THE TRADEMARKS OF THEIR RESPECTIVE OWNERS.

EDUCBA
Free Data Science Course

SPSS, Data visualization with Python, Matplotlib Library, Seaborn Package

*Please provide your correct email id. Login details for this Free course will be emailed to you

By signing up, you agree to our Terms of Use and Privacy Policy.

EDUCBA Login

Forgot Password?

By signing up, you agree to our Terms of Use and Privacy Policy.

EDUCBA
Free Data Science Course

Hadoop, Data Science, Statistics & others

*Please provide your correct email id. Login details for this Free course will be emailed to you

By signing up, you agree to our Terms of Use and Privacy Policy.

EDUCBA

*Please provide your correct email id. Login details for this Free course will be emailed to you

By signing up, you agree to our Terms of Use and Privacy Policy.

Let’s Get Started

By signing up, you agree to our Terms of Use and Privacy Policy.

This website or its third-party tools use cookies, which are necessary to its functioning and required to achieve the purposes illustrated in the cookie policy. By closing this banner, scrolling this page, clicking a link or continuing to browse otherwise, you agree to our Privacy Policy

Loading . . .
Quiz
Question:

Answer:

Quiz Result
Total QuestionsCorrect AnswersWrong AnswersPercentage

Explore 1000+ varieties of Mock tests View more