Updated March 10, 2023
Introduction to Matlab Patch
“A low-level graphics function which helps to plot the one or more filed polygonal regions known as MATLAB PATCH function”. Patch function plots one or more objects polygonal according to the input coordinates of the vertices. In a patch function, we can color the polygon according to our requirements. In this topic, we are going to learn about Matlab Patch. In this topic, we are going to learn about Matlab Patch.
Syntax
patch( X, Y, C)
How does Patchwork in Matlab?
To plot the one or more filed polygonal regions in MATLAB, the PATCH function is used. According to the provided coordinates of vertices, the patch function plot the polygonal. The patch function automatically connects the past (x,y) coordinate with the next (x,y) coordinate. Hence it is easy to plot the polygonal with a patch function.
Here some simple steps to plot the polygonal using the patch function.
Step 1: First, we take all x-axis coordinates in the variable
Step 2: then, we take all y-axis coordinates in another variable.
Step 3: After that, we can use the patch function to plot the polygonal.
Step 4: execute the Matlab code to get the output.
Examples of Matlab Patch
Given below are the examples of Matlab patch:
Example #1
Let us consider the example of the patch function to plot a rhombus with vertices at (0,0), (5,0), (6,3), and (1,3). For the patch function, we must provide the coordinate of its vertices. So first, we take co-ordinates of the rhombus. We were having the rhombus coordinate in variables “x” and “y”, respectively. X-axis coordinates are taken in the “x” variable, and Y-axis coordinates are taken in the “y” variable. x = [0 1 1 0]; and y = [0 0 0 1]; this line is used to get the coordinates of vertices. After taking the coordinates in Matlab, the ‘patch’ function is used to plot the rhombus. patch(x,y,’blue’) this line plots the rhombus using the coordinates. The patch function automatically connects the past (x,y) coordinate with the next (x,y) coordinate. Here ‘blue’ indicates the color of the polygonal. We can change the color according to the requirement.
Code:
clc;

clear all ;

close all ;

x = [ 0 5 6 1] ;

y = [ 0 0 3 3];

patch(x,y,'blue')
Output:
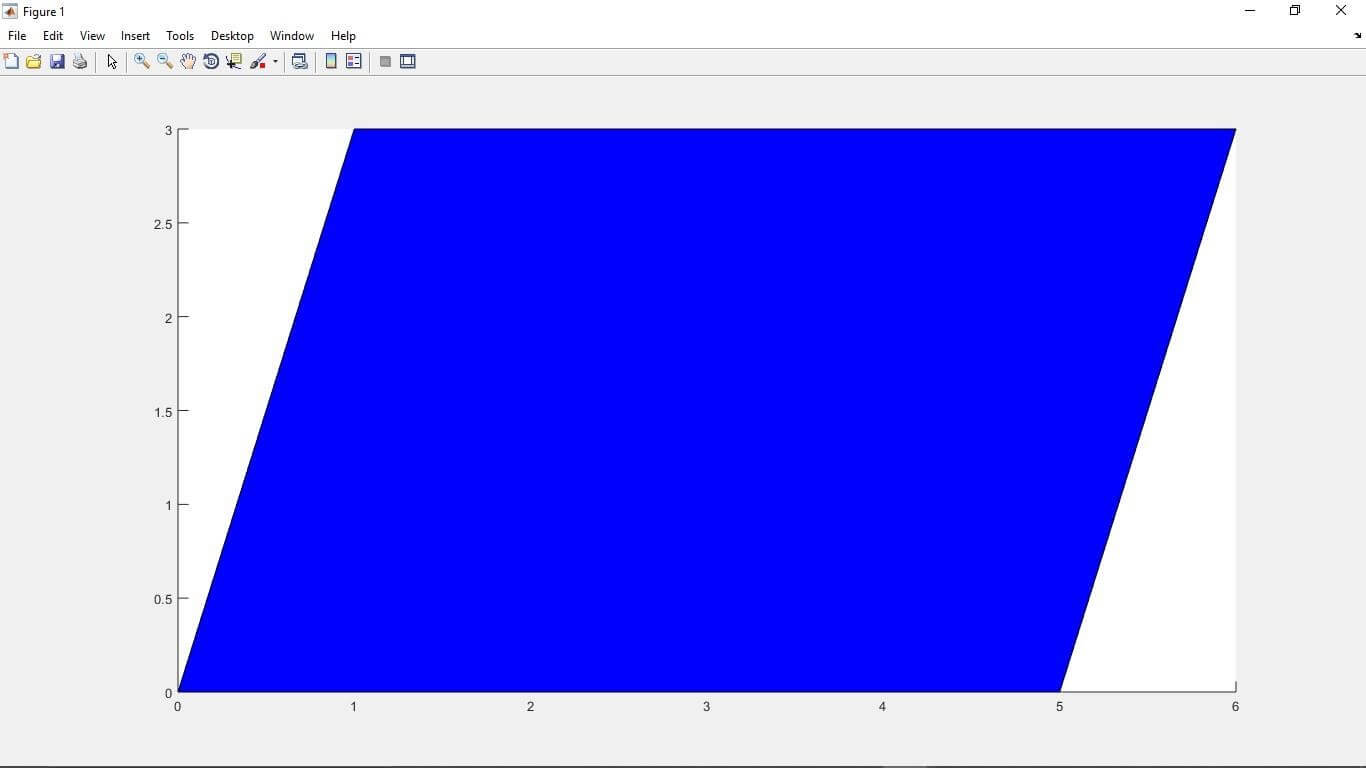
Figure 1
Example #2
Let us consider another example of the Matlab patch function. In this example, we see how we can plot the two polygonal in Matlab using the patch function. As we know, for the patch function, we need the first coordinates of the vertices. In a patch function, we can color the polygon according to our requirements. Hence we take all coordinates in variables ‘A’ and ‘B’, respectively. After getting all coordinates to plot polygonal patch function is used. A = [2 6; 2 5; 5 8]; and B = [4 0; 6 3; 4 0]; are used to get coordinates of x-axis and y-axis respectively. patch(A, B, ‘red’) line is used to plot the polygonal. Here in the syntax, ‘red’ is used to determine the polygon colors.
Code:
clc;

clear all ;

close all ;

A = [ 2 6 ; 2 5 ; 5 8 ] ;

B = [4 0 ; 6 3 ;  4 0 ] ;

patch( A, B , ' red ' )
Output:
Command window:
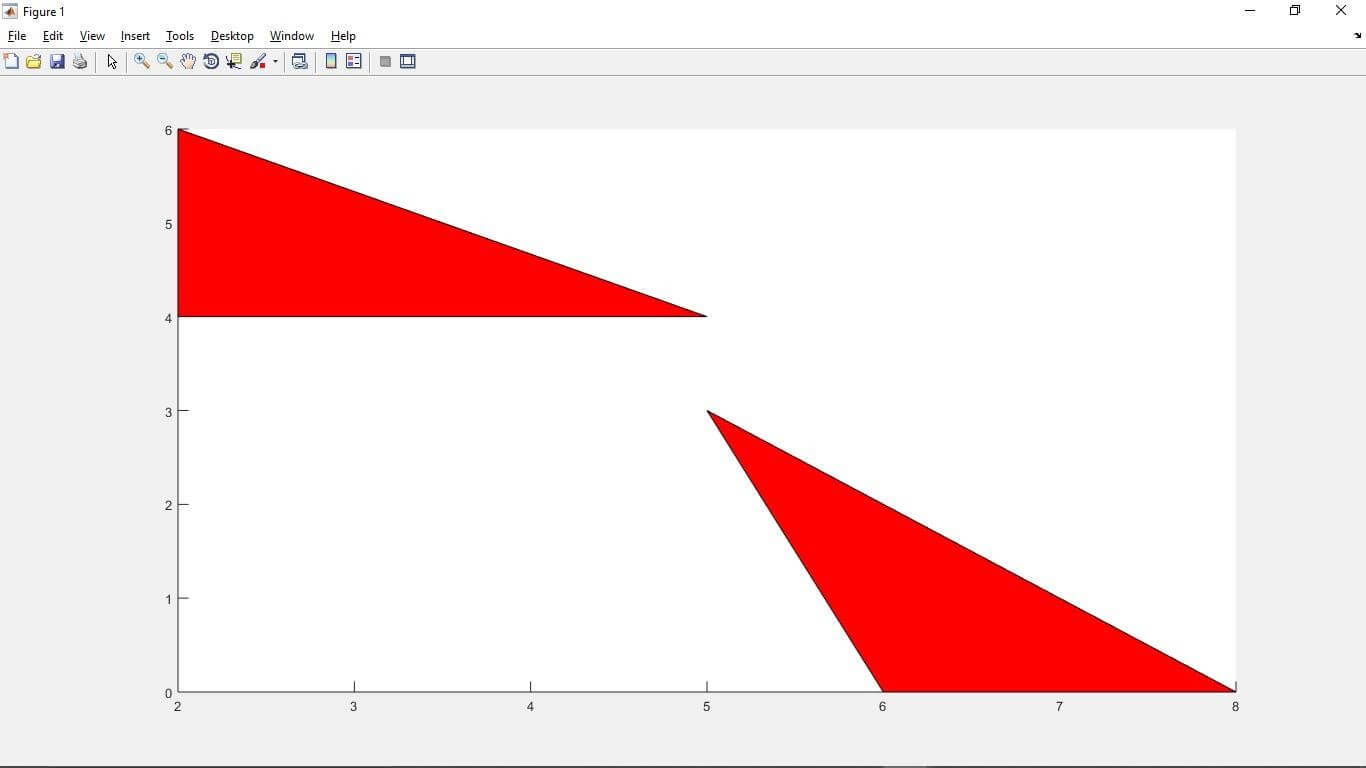
Figure 2
Example #3
Let us consider one more example of the Matlab patch function. In this example, we discussed how the patch function gives multi-color to the polygons. As we know, that patch function is used for plotting one or more polygons. In this example, we can plot the two polygonal in Matlab using the patch function. In a patch function, we can color the polygon according to our requirements. As we know, for the patch function, we need the first coordinates of the vertices. Hence we take all coordinates in variables ‘A’ and ‘B’, respectively. After getting all coordinates to plot polygonal patch function is used. A = [2 5; 2 5; 8 7]; and B = [4 0; 8 2; 4 0]; are used to get coordinates of x-axis and y-axis respectively. D = [0 3; 6 4; 4 5]; line retunes colour values as per the colour bar. The color bar consists of many colors with different values. Figure syntax creates graphical output windows. After executing the code, we can see the polygons in different colors and also the color bar.
Code:
clc;

close all;

clear all;

A = [2 5; 2 5; 8 7] ;

B = [4 0; 8 2; 4 0] ;

D = [0 3; 6 4; 4 5] ;

figure

patch(A,B,D)

colorbar
Output:
Command window:
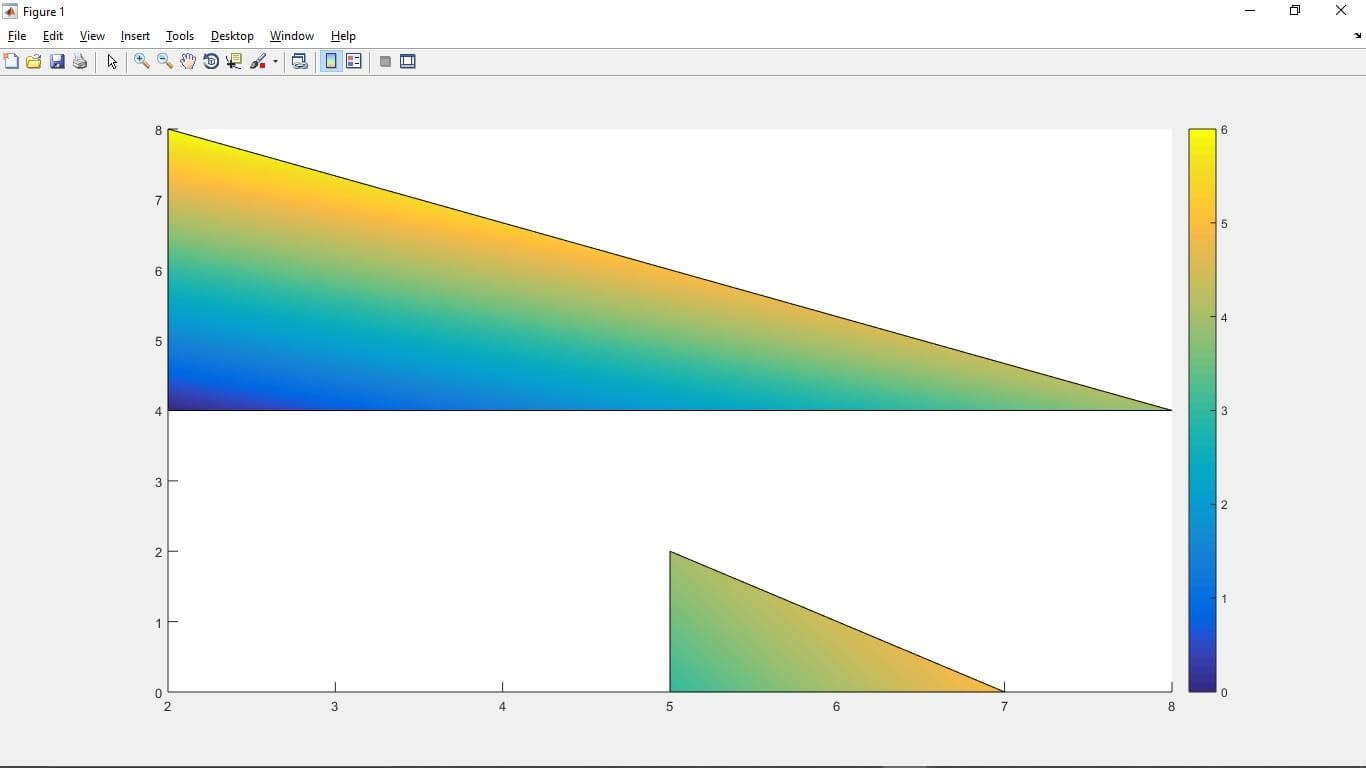
Figure 3
Conclusion
In this article, we saw the concept of the Matlab patch function. Basically, patch is used for plotting one or more polygons. Then saw syntax related to Matlab patch statements and how it is used in Matlab code. Also, we saw some examples related to the patch statement.
Recommended Articles
This is a guide to Matlab Patch. Here we discuss How does Patchwork in Matlab and Examples along with the codes and outputs. You may also have a look at the following articles to learn more –
