EDUCBA

EDUCBA

MENUMENU
  • Free Tutorials
  • Free Courses
  • Certification Courses
  • 360+ Courses All in One Bundle
  • Login
Home Data Science Data Science Tutorials Matlab Tutorial Matlab Image Processing
Secondary Sidebar
Matlab Tutorial
  • Functions
    • MATLAB Functions
    • MATLAB user defined function
    • Calling Functions in MATLAB
    • Transfer Functions in MATLAB
    • Anonymous Functions in MATLAB
    • Inline Functions in MATLAB
    • Bessel Functions in MATLAB
    • Mean Function in MATLAB
    • Find Function MATLAB
    • Filter Function in MATLAB
    • IIR Filter MATLAB
    • Piecewise Function in MATLAB
    • Sum Function in MATLAB
    • Simulink MATLAB Function
    • MATLAB Create Function
    • MATLAB Inverse Function
    • MATLAB Count
    • Step Function MATLAB
    • MATLAB limit
    • Fminsearch in MATLAB
    • Covariance in MATLAB
    • Summation in MATLAB
    • Linear Fit MATLAB
    • MATLAB?linear regression
    • MATLAB Derivative
    • MATLAB Derivative of Function
    • MATLAB Comet()
    • Fzero MATLAB
    • xlabel MATLAB
    • Matplotlib Legend
    • Matplotlib Subplots
    • Plot graph MATLAB
    • MATLAB Format
    • MATLAB plot title
    • Multiple Plots in MATLAB
    • MATLAB Indexing
    • Ceil MATLAB
    • Curve Fitting MATLAB
    • MATLAB trapz()
    • MATLAB Normalize
    • MATLAB diff
    • MATLAB sym()
    • MATLAB Syms
    • Absolute Value MATLAB
    • MATLAB Exponential
    • Kalman Filter MATLAB
    • Low Pass Filter MATLAB
    • Bandpass Filter MATLAB
    • MATLAB Unique
    • Trapezoidal Rule MATLAB
    • MATLAB Root Finding
    • MATLAB stem()
    • MATLAB loglog()
    • MATLAB Autocorrelation
    • MATLAB Sort
    • Simplify MATLAB
    • Cumsum MATLAB
    • Eval Function MATLAB
    • Polyval MATLAB
    • MATLAB Colon
    • MATLAB Eigenvalues
    • MATLAB fit
    • Delta Function MATLAB
    • MATLAB Remainder
    • Differentiation in MATLAB
    • Permute MATLAB
    • isempty MATLAB
    • MATLAB text()
    • MATLAB Display Text
    • Varargin in MATLAB
    • MATLAB gca
    • MATLAB fill()
    • MATLAB pcolor()
    • MATLAB min
    • MATLAB xcorr
    • MATLAB? color codes
    • Semilogy MATLAB
    • MATLAB? eye
    • feval MATLAB
    • num2str in MATLAB
    • MATLAB Images
    • MATLAB Image? Segmentation
    • Imagesc MATLAB
    • MATLAB Image Processing
    • MATLAB Image Resize
    • MATLAB Flag
    • MATLAB fopen
    • Strcmp MATLAB
    • MATLAB fwrite
    • MATLAB fft()
    • MATLAB zeros()
    • MATLAB textread
    • Arctan MATLAB
    • MATLAB Scripts
    • Butterworth filter MATLAB
    • MATLAB Findpeaks
    • MATLAB find Index
    • MATLAB Cell
    • MATLAB Unit Step Function
    • MATLAB Backslash
    • MATLAB Mod
    • Size Function in MATLAB
    • Secant MATLAB
  • Basic
    • MATLAB Area Under Curve
    • MATLAB not equal
    • MATLAB max
    • MATLAB exist
    • MATLAB Table
    • MATLAB regression
    • MATLAB Lists
    • MATLAB quantile
    • MATLAB Round
    • MATLAB readtable
    • MATLAB disp
    • MATLAB Standard Deviation
    • MATLAB quadprog
    • MATLAB Transpose
    • Introduction to MATLAB
    • Advantages of MATLAB
    • MATLAB Features
    • Taylor Series MATLAB
    • MATLAB Z Transform
    • fsolve in MATLAB
    • MATLAB QR
    • Career in MATLAB
    • Uses Of MATLAB
    • MATLAB Free
    • How to Install MATLAB
    • How to Use MATLAB?
    • MATLAB Version
    • MATLAB Compiler
    • MATLAB Commands
    • MATLAB Block Comment
    • MATLAB? sprintf
    • MATLAB fprintf
    • Data Types in MATLAB
    • MATLAB Integral
    • MATLAB Double Integral
    • MATLAB boolean
    • MATLAB vpa
    • MATLAB Object
    • MATLAB Annotation
    • MATLAB Variables
    • MATLAB Global Variables
    • MATLAB Operators
    • MATLAB Logical Operators
    • MATLAB nan
    • MATLAB Patch
    • MATLAB AND Operator
    • MATLAB OR Operator
    • Vectors in MATLAB
    • What is Simulink in MATLAB
    • MATLAB Interpolation
    • MATLAB Imread
    • fscanf MATLAB
    • Euler Method MATLAB
    • Root Locus MATLAB
    • MATLAB return
    • Bode Plot MATLAB
    • Nargin MATLAB
    • MATLAB Matrix Inverse
    • MATLAB String to Number
    • MATLAB string
    • MATLAB ColorBar
    • MATLAB Surfc
    • MATLAB Concatenate
    • NUMEL MATLAB
    • MATLAB? File Extension
    • MATLAB File
    • MATLAB Smooth
    • MATLAB ones
    • Exponential in MATLAB
    • MATLAB ksdensity
    • MATLAB log
    • MATLAB Append
    • MATLAB hold on
    • MATLAB Magnitude of Vector
    • Heatmap in MATLAB
    • MATLAB xticks
    • MATLAB randn
  • Control Statements
    • IF-Else Statement in MATLAB
    • If Statement in MATLAB
    • Loops in MATLAB
    • For Loop in MATLAB
    • While Loop in MATLAB
    • do while loop in MATLAB
    • Nested Loop in MATLAB
    • Switch Statement in MATLAB
    • Break in MATLAB
  • Matrix
    • Matrix in MATLAB
    • 3D Matrix in MATLAB
    • Transpose Matrix MATLAB
    • Sparse Matrix in MATLAB
    • Matrix Multiplication in MATLAB
    • Identity Matrix in MATLAB
    • MATLAB?writematrix
  • Advanced
    • MATLAB Class
    • Arrays in MATLAB
    • Matlab find value in array
    • MATLAB Grader
    • Power Spectral Density MATLAB
    • Matlab Textscan
    • String Array in MATLAB
    • MATLAB Random Numbers
    • Matlab Dot
    • MATLAB 2D Array
    • MATLAB? zero padding
    • MATLAB sort matrix
    • MATLAB Plot Function
    • 2D Plots in MATLAB
    • 3D Plots in MATLAB
    • MATLAB Fread
    • Spectrogram MATLAB
    • MATLAB Average
    • MATLAB exponent
    • MATLAB not enough input arguments
    • MATLAB comment
    • MATLAB zpk
    • Scatter Plots in MATLAB
    • MATLAB 3d scatter plot
    • Bar Graph in MATLAB
    • Bar Plot MATLAB
    • Log Plot MATLAB
    • Polar Plot in MATLAB
    • Surface Plot in MATLAB
    • MATLAB Plot Circle
    • Boxplot in MATLAB
    • MATLAB Plot Multiple Lines
    • Linspace MATLAB
    • Histogram in MATLAB
    • Plot Vector MATLAB
    • MATLAB Legend
    • MATLAB Plot Legend
    • MATLAB ezplots
    • Column Vector MATLAB
    • MATLAB Plot Marker
    • MATLAB LineWidth
    • MATLAB Line Style
    • Contour plot in MATLAB
    • MATLAB Sine Wave
    • Reshape in MATLAB
    • Natural Log in MATLAB
    • Random Number Generator in MATLAB
    • Complex Numbers in MATLAB
    • MATLAB Figure
    • Heatmap in MATLAB
    • MATLAB Technical Computing
    • Colors in MATLAB
    • Colormap in MATLAB
    • MATLAB Plot Colors
    • MATLAB fplot()
    • MATLAB Stacked Bar
    • MATLAB sphere()
    • MATLAB cylinder()
    • MATLAB mesh()
    • Pie Chart in MATLAB
    • MATLAB Gradient
    • Grid on MATLAB
    • Repmat in MATLAB
    • dlmread in MATLAB
    • Meshgrid in MATLAB
    • MATLAB Struct
    • MATLAB Cross Product
    • MATLAB colorbar Label
    • MATLAB Save Variable
    • MATLAB Saveas
    • MATLAB Cell Array
    • Polynomial in MATLAB
    • ismember MATLAB
    • Heaviside MATLAB
    • MATLAB rref
    • MATLAB polyfit()
    • MATLAB xlim
    • MATLAB Variance
    • Optimset MATLAB
    • Quiver MATLAB
    • Newton Raphson MATLAB
    • Mat2cell MATLAB
    • Magnitude MATLAB
    • format long MATLAB
    • Dot Product MATLAB
    • Jacobian MATLAB
    • What is Matlab?
    • Convolution MATLAB
    • Moving Average MATLAB
    • Fourier Series MATLAB
    • Gaussian Fit MATLAB
    • Bisection Method MATLAB
    • Laplace Transform MATLAB
    • Fourier Transform MATLAB
    • Signal Processing MATLAB
    • MATLAB Forms
    • Complex Conjugate MATLAB
    • MATLAB Write to File
    • uigetfile MATLAB
    • MATLAB Toolbox
    • MATLAB Errorbar
    • MATLAB Index Exceeds Matrix Dimensions
    • Nyquist MATLAB
    • Impulse Response MATLAB
    • xlsread MATLAB
    • MATLAB xlswrite
    • Matplotlib Scatter
    • MATLAB Import Data
    • MATLAB Export Data
    • MATLAB Read CSV
  • Programs
    • Square Root in MATLAB
    • Square Wave MATLAB
    • Squeeze MATLAB
    • Factorial in MATLAB
    • Cell to String MATLAB
  • Interview Questions
    • MATLAB Interview Questions

Related Courses

MATLAB Certification Course

R Programming Course

All in One Data Science Courses

Matlab Image Processing

Matlab Image Processing

Introduction to Matlab Image Processing

Image Processing apps are provided by MATLAB in the form of a toolbox that helps us in automating commonly used image processing techniques and workflows by enabling interactive segmentation of image data, comparison of image registration methods, and batch processing of large datasets.

Image processing in MATLAB lets us explore any image or video and make changes like adjusting the contrast, manipulating ROI (regions of interest) and create histograms to understand the definition of the image.

Start Your Free Data Science Course

Hadoop, Data Science, Statistics & others

Here is the list of some of the most commonly used functions for processing images in MATLAB:

All in One Data Science Bundle(360+ Courses, 50+ projects)
Python TutorialMachine LearningAWSArtificial Intelligence
TableauR ProgrammingPowerBIDeep Learning
Price
View Courses
360+ Online Courses | 50+ projects | 1500+ Hours | Verifiable Certificates | Lifetime Access
4.7 (85,992 ratings)

Syntax & Description

  1. imread (): This function is used to read or load the image which we want to process
  2. imshow (): This function is used to display the image that we have loaded
  3. imagesc (): This function is used to display the image by utilizing the full set of colors present in the colormap. A color scale can also be used after calling this function to get a better idea of the colors present
  4. imhist (): Using This function, we can check how the pixel intensity of the image is distributed
  5. histeq (): Using this function, we can edit the contrast of our image
  6. imwrite (): This function is used to insert our edited image into a file
  7. iminfo (): This function is used to confirm if our edited file is loaded into a disk file

Functions of Matlab Image Processing

Let us now understand the use of all the functions in MATLAB. First, we will use an image stored in MATLAB’s image processing app and execute all the functions in steps for that image.

Step #1

In the first step, we Load or Read the image into our workspace.

Code:

imageInput = imread (‘kids.tif');

[‘imread’ will read the image and will store it in the array ‘imageInput’]

Step #2

In this step, we will display our image in the workspace.

Code:

imshow (imageInput)

[‘imshow’ will display the image as output in the workspace]

Output:

Matlab Image Processing output 1

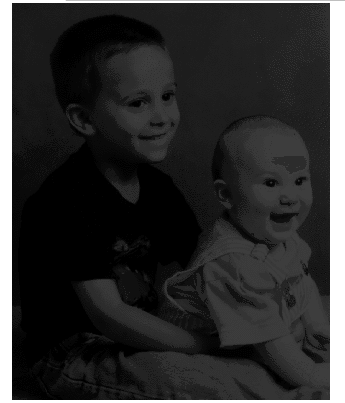
As we can see in the output, the image is loaded in our workspace.

Step #3

In this step, we will display our image with the colors from the colormap. We will also use a colorbar to check the intensity of the colors.

Code:

imagesc (imageInput)

[‘imagesc’ will display the image with a full range of colors from the colormap]

colorbar

[‘colorbar’ is used to display a scale next to the image to check the intensity of the colors]

Output:

Matlab Image Processing output 2

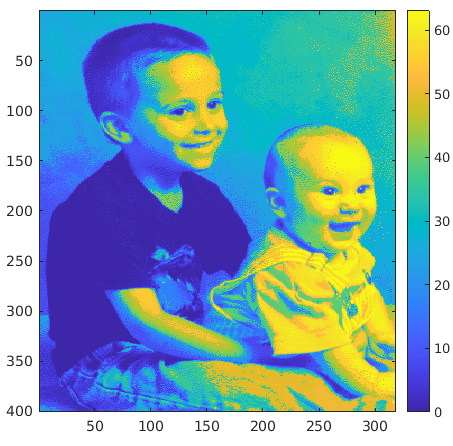
As we can see in the output, the image is displayed and has a full range of colors in the colormap, and we also have a colorbar next to it.

Step #4

In this step, we will check the intensity of pixels in our image. We will be using the figure function to display the intensity in the form of a histogram.

Code:

figure

[Used to display the histogram for intensity]

imhist (imageInput)

[‘imhist’ will create the distribution of the pixel intensities]

Output:

Matlab Image Processing output 3

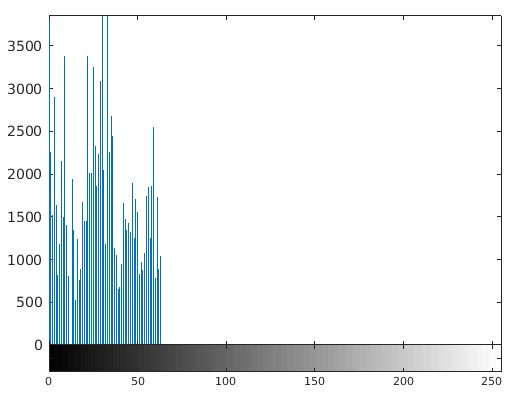
As we can see in the output, the range of pixel intensity for our image is very narrow, i.e. the values are concentrated in a small range.

Step #5

In this step, we will edit the contrast of our image. This is done because we found in the above step that our image has a very narrow pixel intensity.

Code:

newImage = histeq (imageInput);

[‘histeq function will improve the pixel intensity, or we can say that it will improve the contrast of our image]

figure
imshow (newImage)

[Displaying our new image (with improved contrast]

Output:

output 4

As we can see in the output, the contrast of our image has improved drastically.

Step #6

In this step, let us call the ‘imhist’ function again with ‘newImage’ as the input. This will confirm that contrast or pixel intensities of the new image created are now uniformly distributed.

Code:

figure
imhist (newImage)

Output:

output 5

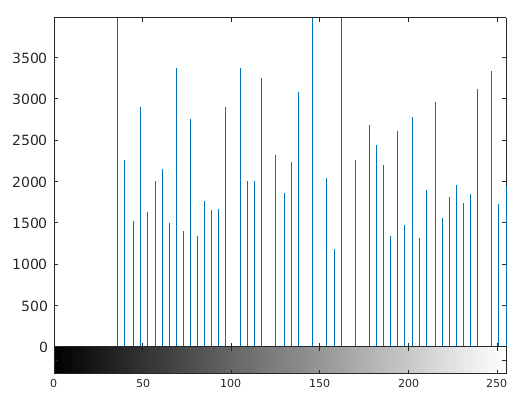
As we can see in the histogram above, the pixel intensities of the new image created are now uniformly distributed.

Step #7

In this step, we will insert the new image into the disk file.

Code:

imwrite (newImage, 'kids2.png');

[Using ‘imwrite’ to save the image in disk file]

Step #8

Finally, we will confirm if our image is saved in the disk file or not using the ‘iminfo’ function. This will also give us all other details like file size, format, width, height, etc.

Code:

imfinfo ('kids2.png')

[Getting the information of the saved file]

Output:

output 6

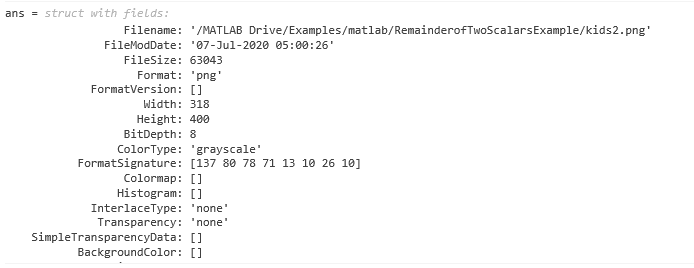
As we can see in the output, the file is saved as expected by us. We also have all other information related to the image.

Conclusion

  1. Image processing app can be used in MATLAB to perform various operations on an image, ranging from loading the image, editing it and saving it in the disk file.
  2. The image processing can be used to process both 2D& 3D images

Recommended Articles

This is a guide to Matlab Image Processing. Here we discuss the Functions of Matlab Image Processing and will execute all the functions in steps. You may also have a look at the following articles to learn more –

  1. xlsread Matlab
  2. Matlab Images
  3. MATLAB Unique
  4. Matlab trapz()
Popular Course in this category
MATLAB Training (3 Courses, 1 Project)
  3 Online Courses |  1 Hands-on Project |  8+ Hours |  Verifiable Certificate of Completion
4.5
Price

View Course

Related Courses

R Programming Training (13 Courses, 20+ Projects)4.9
All in One Data Science Bundle (360+ Courses, 50+ projects)4.8
0 Shares
Share
Tweet
Share
Primary Sidebar
Footer
About Us
  • Blog
  • Who is EDUCBA?
  • Sign Up
  • Live Classes
  • Corporate Training
  • Certificate from Top Institutions
  • Contact Us
  • Verifiable Certificate
  • Reviews
  • Terms and Conditions
  • Privacy Policy
  •  
Apps
  • iPhone & iPad
  • Android
Resources
  • Free Courses
  • Database Management
  • Machine Learning
  • All Tutorials
Certification Courses
  • All Courses
  • Data Science Course - All in One Bundle
  • Machine Learning Course
  • Hadoop Certification Training
  • Cloud Computing Training Course
  • R Programming Course
  • AWS Training Course
  • SAS Training Course

ISO 10004:2018 & ISO 9001:2015 Certified

© 2022 - EDUCBA. ALL RIGHTS RESERVED. THE CERTIFICATION NAMES ARE THE TRADEMARKS OF THEIR RESPECTIVE OWNERS.

EDUCBA
Free Data Science Course

SPSS, Data visualization with Python, Matplotlib Library, Seaborn Package

*Please provide your correct email id. Login details for this Free course will be emailed to you

By signing up, you agree to our Terms of Use and Privacy Policy.

EDUCBA Login

Forgot Password?

By signing up, you agree to our Terms of Use and Privacy Policy.

EDUCBA
Free Data Science Course

Hadoop, Data Science, Statistics & others

*Please provide your correct email id. Login details for this Free course will be emailed to you

By signing up, you agree to our Terms of Use and Privacy Policy.

EDUCBA

*Please provide your correct email id. Login details for this Free course will be emailed to you

By signing up, you agree to our Terms of Use and Privacy Policy.

Let’s Get Started

By signing up, you agree to our Terms of Use and Privacy Policy.

This website or its third-party tools use cookies, which are necessary to its functioning and required to achieve the purposes illustrated in the cookie policy. By closing this banner, scrolling this page, clicking a link or continuing to browse otherwise, you agree to our Privacy Policy

Loading . . .
Quiz
Question:

Answer:

Quiz Result
Total QuestionsCorrect AnswersWrong AnswersPercentage

Explore 1000+ varieties of Mock tests View more