Updated March 8, 2023

Introduction to Matlab Area Under Curve
The following article provides an outline for Matlab Area Under Curve. Matlab is a programming environment which is interactive and is used in scientific computing. It is extensively used in many technical fields where problem-solving, data analysis, algorithm development, and experimentation are required. The software, which is discipline-specific, is extensively written using Matlab.
Techniques to Find Area Under Curve in Matlab
- Integration using the Integral function is useful in finding areas under the curves. It is the reverse of differentiation in calculus, and hence the functions are integrated by finding their anti-derivatives.
- ‘Trapz function’ in Matlab can also be used to calculate the area under the curve.
- ‘Cumtrapz function’ is used to calculate the area under the curve for a portion.
Syntax:
A = integral (Fx, Xminimum, Xmaximum)
A = trapz (x, y)
A = cumtrapz (x, y)
Description:
- A = integral (Fx, Xminimum, Xmaximum) will calculate the numeric integration of input function ‘Fx’, which in turn signifies the area under a curve.
- A = trapz (x, y) will also give the area under the curve represented by ‘y’. Here ‘x’ is used to define the range or limits between which we want the area.
- A = cumtrapz (x, y) will compute the cumulative integration of Y w.r.t X. This is done using the trapezoidal integration and can be used to calculate the area under the curve for a portion.
Examples of Matlab Area Under Curve
Given below shows the code to calculate the area under a curve in Matlab using an integral function:
Example #1
In this example, we will use a polynomial function of degree 5 and will integrate it between the limits 0 to 2.
We will follow the following 2 steps:
- Create the function of degree 5 in Matlab.
- Calculate the area under a curve using an integral function.
Code:
syms x
[Initializing the variable ‘x’]Fx = @(x) 4*x.^5 + x.^4 – 3*x.^2
[Creating the polynomial function of degree 5]A = integral (Fx, 0, 2)
[Passing input function ‘Fx’ and the required limits] [Mathematically, the area under the curve of 4*x.^5 + x.^4 – 3*x.^2, between the limits 0 to 2 is 41.0667]Input:
syms x

Fx = @(x) 4*x.^5 + x.^4 - 3*x.^2

A = integral (Fx, 0, 2)
Output:
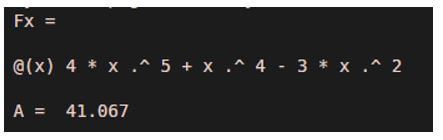
As we can see in the output, we have obtained the area under the curve of our input function ‘Fx’ as 41.0667 using ‘integral function’, which is the same as expected by us.
Let us now see how the code for ‘area under the curve’ looks like in Matlab using the trapz function.
Example #2
In this example, we will use a sine wave and will find the area under it between the limits 0 to 50.
We will follow the following 2 steps:
- Create the sine wave in Matlab.
- Use the trapz function to calculate the area under curve.
Code:
x = 0:50;
[Defining the limits for area under curve]y = 20 – 50 * sin (pi / 200 * x);
[Creating the sine wave]A = trapz (x, y)
[Passing input wave ‘y’ and the required limits to the ‘trapz function’] [Mathematically, the area under the curve of 20 – 50 * sin (pi / 200 * x), between the limits 0 to 50 is 67.7111]Input:
x = 0:50;

y = 20 - 50 * sin (pi / 200 * x);

A = trapz (x, y)
Output:
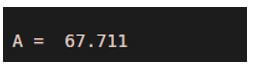
As we can see in the output, we have obtained the area under the curve of our input sine wave ‘y’ as 67.7111 using the ‘trapz function’, which is the same as expected by us.
Let us now see how the code for ‘area under the curve’ looks like in Matlab using the ‘cumtrapz function’. We will use the ‘cumtrapz function’ to calculate the area of a particular portion under the curve.
Example #3
In this example, we will use the same sine wave as we used in the above example. Here, we will find the area of the portion between the limits 25 to 40.
Code:
x=[0:50];
[Defining the limits for area under curve]y=20-50*sin(pi/200*x);
[Creating the sine wave]A = cumtrapz (x,y);
[Passing input wave ‘y’ and the required limits to the ‘cumtrapz function’]newFunction = @(p,q) max(A(x<=q)) – min(A(x>=p));
[creating function using ‘cumtrapz’ output]portionArea = newFunction(25, 40)
[Calculating the portion area between 25 and 40] [Mathematically, the area under curve 20-50*sin(pi/200*x), between the limits 25 to 40 is 190.4991]Input:
x=[0:50];

y=20-50*sin(pi/200*x);

A = cumtrapz (x,y);

newFunction = @(p,q) max(A(x<=q)) - min(A(x>=p));

portionArea = newFunction(25, 40)
Output:

As we can see in the output, we have obtained an area under the curve of our input sine wave for the portion below 25 to 40 using the ‘cumtrapz function’.
Conclusion
‘Area Under Curve’ can be calculated in Matlab using the integration of any function. We can set the desired limits using the arguments of an integral function. Another way to achieve the same is using the ‘Trapz function’. ‘cumtrapz function’ can be used if we need an area of a specific portion of the curve.
Recommended Articles
This is a guide to Matlab Area Under Curve. Here we discuss the introduction, techniques to find the area under a curve in Matlab and examples. You may also have a look at the following articles to learn more –
