Updated March 10, 2023
Introduction to Imagesc Matlab
The function is used to show a figure with calibrated colors is known as the ‘imagesc function’. To implement the imagesc function in Matlab, the “imagesc (D)” syntax is used. D is the name of the array which contains the array elements. Imagesc function is used to show the data into array D as a figure by using the full span of colors in the color map. The specific color is allocated for each element in the array for one picture element of the figure. The produced figure is a p-by-q grille of picture element s where p is the lots of rows and q is the lots of columns in array D.
Syntax
The syntax of ‘imagesc function’ is as follows:-
- imagesc(C)
- imagesc(x,y,C)
- imagesc(___,clims)
- im = imagesc(___)
How Does Imagesc Work in Matlab?
In Matlab, the ‘imagesc’ function uses an “imagesc(D)” statement to show a figure with calibrated colors.
Steps to implementing the ‘imagesc’ function:
Step 1: First input argument is taken in the variables.
Step 2: Then, we use the “imagesc(D)” statement.
Step 3: Then, we use “colorbar” to display the color bar.
Examples of Imagesc Matlab
Given below are the examples of Imagesc Matlab:
Example #1
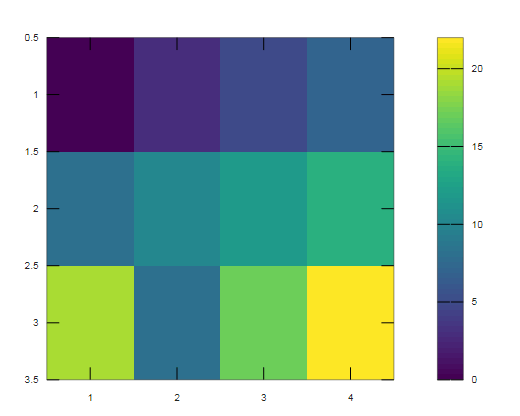
Let us see the example for the ‘imagesc function’.In this example, create matrix C.
We will consider the C variable, which contains input arguments C = [0 3 5 7; 8 10 12 14; 19 8 17 22]; assign the input elements into the matrix C. Then, to display an image of the data in C, we used the imagesc function. The syntax imagesc(C)display images with calibrated colors for all the data of matrix C. The specific color is allocated for each element in the array for one picture element of the image. To show the running color map, we add a color bar to the graph. By default, the image used the full scale of the colormap because imagesc scales the color limits, where the lowest value in C maps to the first color in the color map and the highest value maps to the last color.
Code:
clc;

close all;

clear all;

C = [0 3 5 7; 8 10 12 14; 19 8 17 22];

imagesc(C)

colorbar
Output:
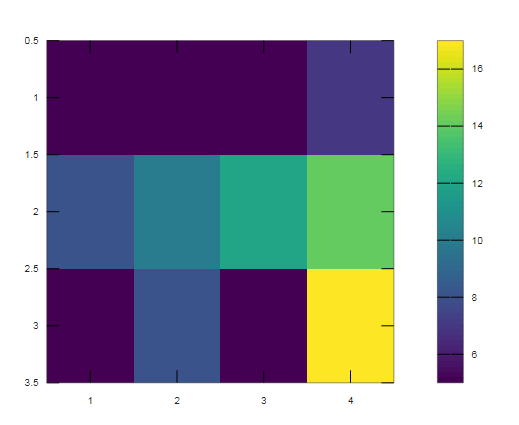
Example #2
In the next example for ‘imagesc function’, we create an image of a C array, and we set the color limits. We set the color limit as that values of 4 or less map to the first color in the colormap and values of 17 or more maps to the last color in the colormap. Hence we create array C. We take the C variable, which contains input arguments. C = [0 3 5 7; 8 10 12 14; 1 8 2 22];assign the input elements into the array C. Then to set colour limit we used syntax “clims = [5 17]”. Then to display an image of the data in C, we used the imagesc function. The syntax “imagesc(C,clims)” displays images with calibrated colors for all the data of matrix C. The specific color is allocated for each element in the array for one picture element of the image. To show the running colormap, we add a color bar to the graph. By default, the image used the full scale of the colormap because imagesc scales the color limits, where the lowest value in C maps to the first color in the color map and the highest value maps to the last color.
Code:
clc;

close all;

clear all;

C = [0 3 5 7; 8 10 12 14; 1 8 2 22];

clims = [5 17];

imagesc(C,clims)

colorbar
Output:
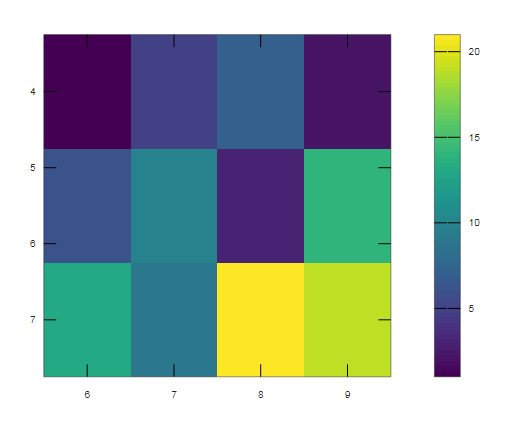
Example #3
Let us see another example of the ‘imagesc function’. In this example, we plot the image between a limited scale of the x-axis and the y-axis. So first, we select the scale of the image so that it lies between X-axis and the y-axis. The image is placed on the scale as that it lays between 6 and 9 on the x-axis and between 4 and 7 on the y-axis. Then we create matrix C. We take the C variable, which contains input arguments. C = [1 5 7 2; 6 10 3 14; 13 9 21 19];assign the input elements into the matrix C. then to display an image of the data in C we used imagesc function. The syntax “imagesc(x,y, C)” displays images with calibrated colors for all the data of matrix C. The image is lies between the x-axis and the y-axis. The specific color is allocated for each element in the array for one picture element of the image. To show the running colormap, we add a color bar to the graph. By default, the image used the full scale of the colormap because imagesc scales the color limits, where the lowest value in C maps to the first color in the color map and the highest value maps to the last color.
Code:
clc;

close all;

clear all;

x = [6 9];

y = [4 7];

C = [1 5 7 2; 6 10 3 14; 13 9 21 19];

imagesc(x,y,C)

colorbar
Output:
Conclusion
In this article, we have seen the concept of imagesc Matlab. Basically, the imagesc function is used with various parameters like data, climbs, arrays, color variation, and many more. For example, we can display the figure by calibrated features by using the imagesc function.
Recommended Articles
This is a guide to Imagesc Matlab. Here we discuss How Does Imagesc Work in Matlab and Examples along with the codes and outputs. You may also have a look at the following articles to learn more –
