Updated July 24, 2023
Definition of Forward PE Ratio
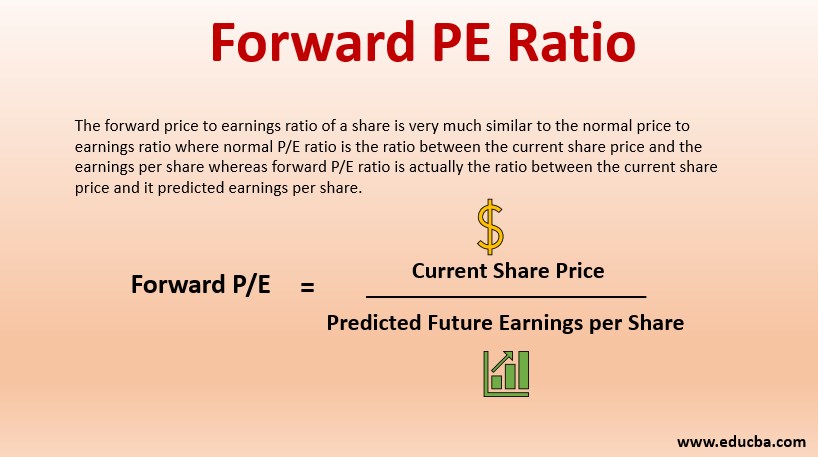
The forward price to earnings ratio of a share is very much similar to the normal price to earnings ratio, where the normal P/E ratio is the ratio between the current share price and the earnings per share, whereas the forward P/E ratio is actually the ratio between the current share price and it predicted earnings per share.
The forward price-to-earnings ratio has a lot of similarities to the normal price-to-earnings ratio. The basic P/E ratio is the ratio between the current share price and the earnings per share, whereas the forward P/E ratio is actually the ratio between the current share price and its predicted earnings per share. The forward P/E ratio uses the concept of forecasted earnings for P/E calculation. The predicted earnings used here is more of an estimate and not as reliable as actual historical earnings.
Formula
The formula to calculate Forward P/E is as follows:
The current share price is the existing price of the share prevailing in the market, and predicted future earnings are defined as the forecasted earnings per share. The forecasted earnings can be the one that has been projected for the upcoming 12 months or for the upcoming full-year fiscal period.
Example of Forward PE Ratio
When it comes to Forward P/E, the most challenging part here is calculating the predicted EPS. The current market price can be easily obtained as it is the present price of the stock which is prevailing in the market. The forecasted EPS can be obtained from third-party sites such as Bloomberg, Yahoo Finance, or else we can create our own reports too. Analyst consensus is also a process to predict the future EPS of a share. Analyst consensus is defined as the average of all the EPS values submitted by various equity research analysts covering the particular stock and finally sharing their estimate to IBES or Bloomberg.
The forward-looking template looks like the below:
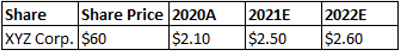
Here we can see a stock named XYZ Corp., whose current prevailing share price in the market I $60. We have three EPS values based on actuals for 2020 and estimates for 2021 and 2022. We can either take the average of both the estimated years or use it in our forward price-to-earnings ratio calculation, or else we can take the predicted earnings of only a single estimated year and proceed accordingly. In this case, the average EPS average for two estimated years, i.e. 2021 and 2022, is $2.55 accordingly. To calculate now the forward P/E, the formula to use will be:
Forward P/E = Current Share Price / Predicted Future Earnings per share
Thus the forward P/E based on the average of two years’ estimates will be $60/$2.55 = 23.5
In the same way, if we take the next year’s estimated EPS and not the average, the forward P/E calculation will tend to become $60/$2.5 = 24.
Forward PE Ratio vs Trailing PE
The forward price-to-earnings ratio has a lot of similarities to the normal price-to-earnings ratio. The basic P/E ratio is the ratio between the current share price and the earnings per share, whereas the forward P/E ratio is actually the ratio between the current share price and its predicted earnings per share. The forward P/E ratio uses the concept of forecasted earnings for P/E calculation. The predicted earnings used here are more of an estimate and not as reliable as actual historical earnings.
The trailing price-to-earnings ratio is again similar to the forward price-to-earnings ratio with the basic difference in the EPS calculation. Here the EPS taken into consideration is the historical or past 12 months calculated one. Thus, the same formula goes for the current market share price divided by historical or past 12 months’ calculated EPS.
The forward P/E uses projected or forecasted earnings, whereas the trailing P/E uses historical or recent past earnings. The trailing P/E uses actual performance statistics, whereas the forward P/E is based on future performance estimates. Trailing P/E is considered to be more reliable as it is based on actual performance rather than expected future earnings. However, trailing P/E also has shortcomings as a company’s earnings never remains constant and can change well over time.
Limitations of Forward PE Ratio
The limitations of a forward price-to-earnings ratio can be as follows:
- As the forward price-to-earnings ratio depends on future performance earnings or estimates, it is exposed to analysts’ miscalculation or biasness.
- Companies could underestimate or overestimate their earnings to counter the consensus estimate when their financial results are announced.
- External analyst providing their numbers or estimates may create confusion in the form of divergence from the actual company estimates.
- Only using the forward price-to-earnings ratio for our analysis is not as safe as if the company suddenly updates its guidance; it can take a toss on our analysis.
- The forecasting method applied varies from analyst to analyst, and thus, reaching a steady consensus is very difficult.
- The earnings can always be inflated or depressed by accounting gains or charges, and thus this will lead to a variation from the actual scenario.
Conclusion
The forward price to earnings ratio is a very effective measure when an investor wants to do a thorough technical analysis of a company before investing in it. It provides a lot of insight but requires a high level of expertise, too, for being solely dependent on it. The best way can be to make use of both the trailing price to earnings ratio coupled with the forward price-to-earnings ratio, which will give a buffer to the actual and future predicted performance. Other than this, when we use the consensus form of forward price to earnings ratio still has certain relevance because it is based on the estimates covered by a good number of expert analysts.
Recommended Articles
This is a guide to Forward PE Ratio. Here we discuss how to calculate Forward PE Ratio along with an example and the difference between Forward PE Ratio vs Trailing PE. You may also look at the following articles to learn more –

