Updated May 3, 2023
Forecast Function in Excel(Table of Contents)
Forecast in Excel
The forecast function available in Excel is the simplest ever forecasting function we could have. This function predicts the selected iteration sequence, but we must have all the rest known sequences, and the rest is known values. The forecast function simply uses the Moving average forecast method to predict the next demand. If we do not know X, we manually enter the number, giving 1 for the first value and so on.
FORECAST Formula in Excel
Below is the FORECAST Formula in Excel:
Arguments of FORECAST Function in Excel :
- X-: This is a numeric value where we need to forecast the new y value
- Known_ Y-: This Known y_values is a dependent array or range of data.
- Known_ X-: This Known x_values is an independent array or range of data.
Features of Forecasting:
- This function is normally concerned with future events
- It is used as a statistical tool & techniques
- Predicting future sales data is its principal application.
- It analyses the present and past data.
Forecasting:
The forecasting function is mainly used in FMCG, financial, accounting, and risk management, where we can predict the future sales figure; assume that an FMCG company has huge sales to find out the next month’s or next year’s sales; this FORECAST function is very useful to predict the exact result which will be useful for the management in analyzing revenue and other promotion reports.
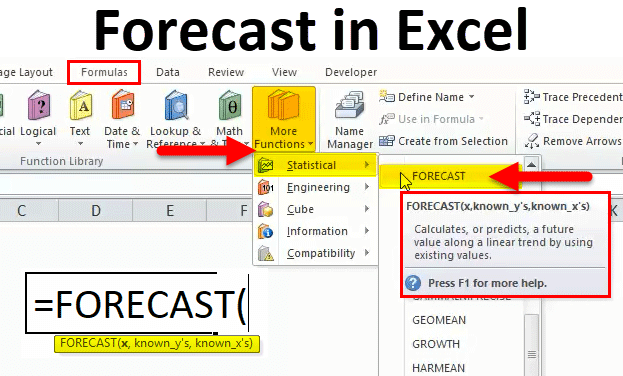
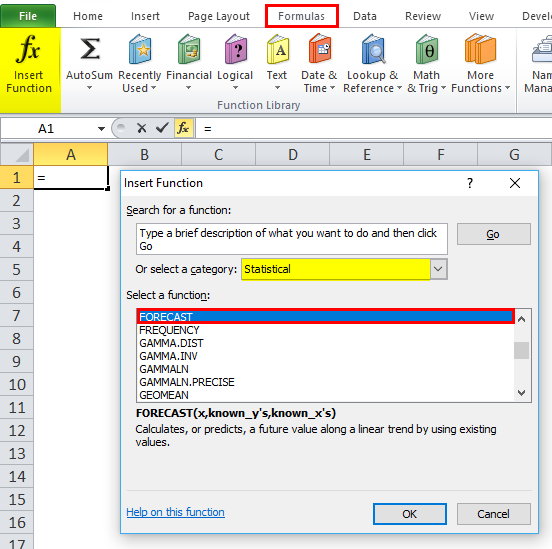
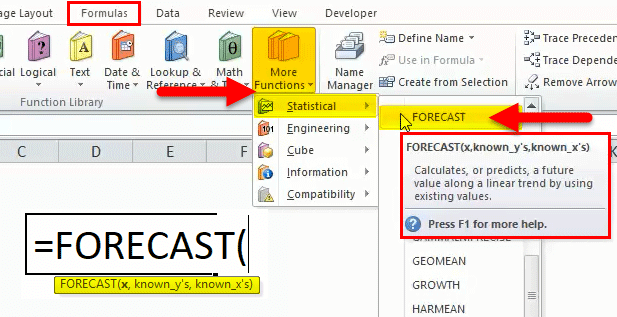
The forecast function will come under the category of a Statistical function here; we will see a step-by-step procedure on how to use it.
- Go to the formula menu and click the insert function. A dialogue box will be displayed. Choose the category statistically. Once you choose the statistical, you will find a list of a function. Choose forecast function
In the advanced version, we can use the shortcut, wherein we can see more functions in the formula menu.
Go to formulas–>Choose More Function–>Statistical–>Forecast
How to use the FORECAST Function in Excel?
FORECAST Function is very simple to use. Let us now see how to use the FORECAST function in Excel with the help of some examples.
Example #1
In this example, we will use the FORECAST function to predict next month’s sales data. Assume that a popular FMCG company has monthly sales data, and the management needs to find the sales forecasting to get the next month’s sales. In this scenario, the forecasting function will be very useful in pointing out future sales.
Here in the below example, we can see that year-wise sales data has given great revenue; now, we will use the forecast function to predict how the sales will be there for 2009.
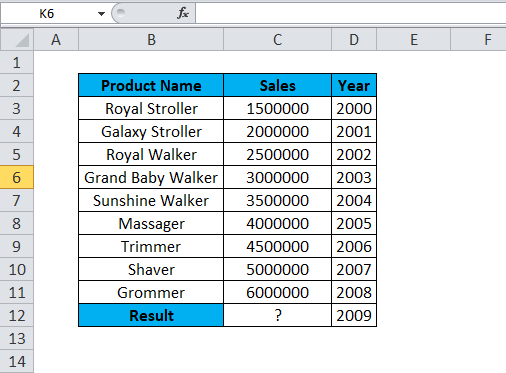
In the above sales data, we can see the product sales item that has earned revenue Year wise. To predict next year’s data, we use the FORECAST function. For 2008 Product Name “ Grommer” earned a sales value of 6000000. To predict the next year, i.e. 2009 Sales value, we can use the FORECAST in Excel shown with the below sales data.
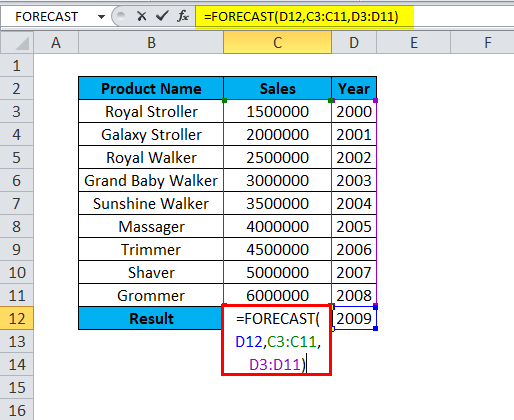
So we have to use the FORECAST in Excel to derive the next year’s sales value where
D12 is x-Numerical Value.
C3:C11 –Know_Y Value.
D3:D11- Known_X Value.
Result:
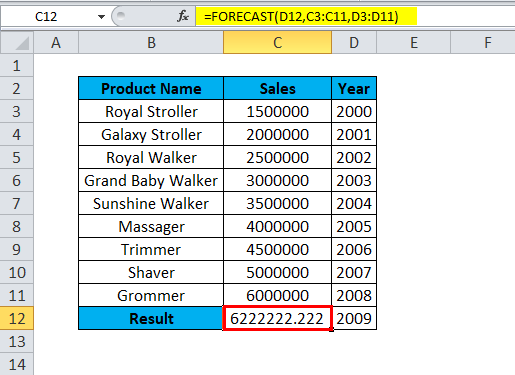
The Sales revenue for Groomer Product for the Year 2009 is 6222222. So we can easily predict the sales revenue for a given product.
Let’s see the above sales data in a dynamic graph format so that it can be viewed easily to understand
To display the above sales data in graphical chart format, follow the below steps:
- Select a cell from C3:D12.
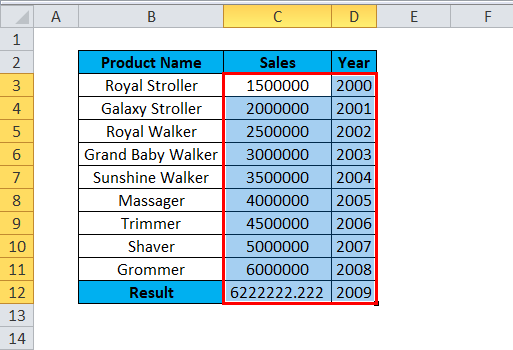
- Select Insert Tab, then select the Line chart option. The in-Line chart option selects the first option.
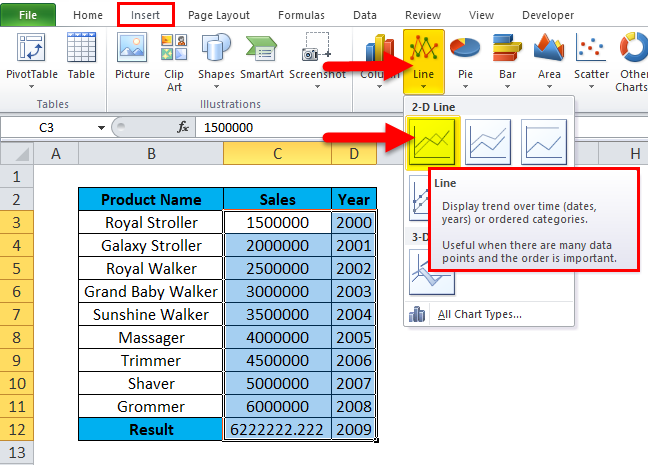
- The chart has been displayed, and the predicted value for the year 2009 has been shown in the below graph format.
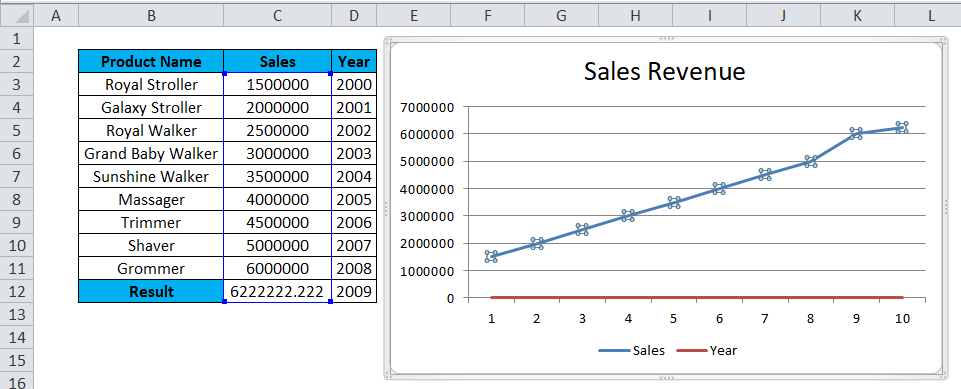
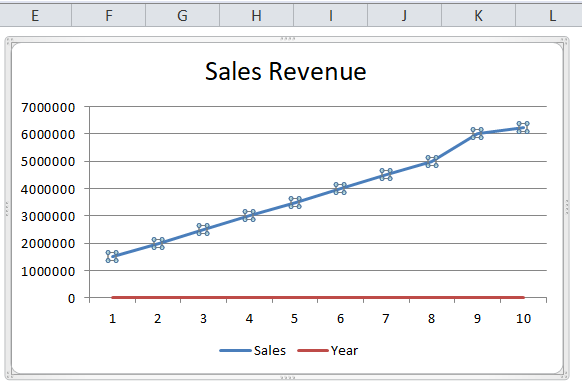
Result:
The below sales data of the line chart clearly shows that for the year 2009, we have more revenue where the blue line goes up, indicating the exact prediction of 6222222.
Example #2
In the below example, we are now going to see month wise sales by using the forecast in excel, whereas we have seen year wise sales in the previous example. Consider the below sales, which have month wise sales data; now, we need to predict the next year month wise sales using the forecast function.

Here we changed some sales value figures to get the accurate forecasting result as shown below.
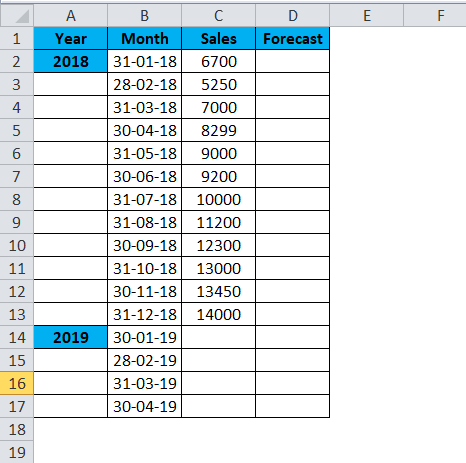
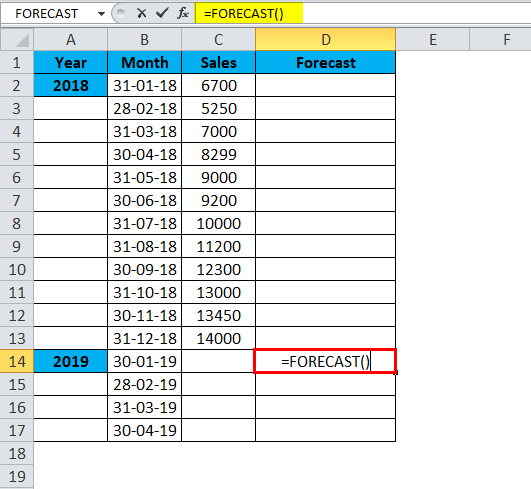
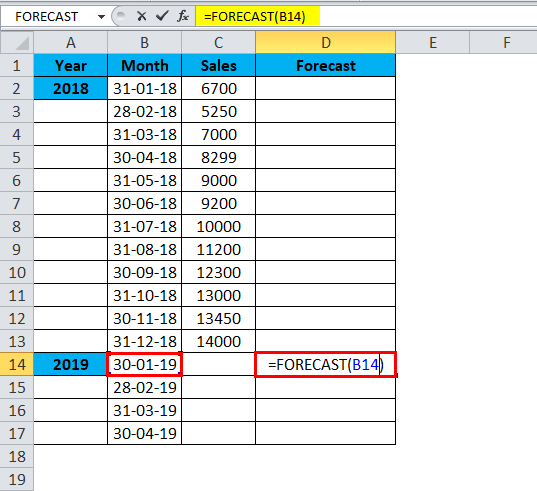
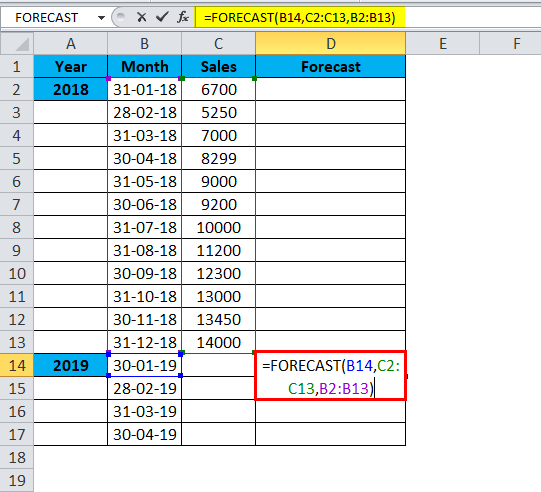
- Insert forecast function
- Select x value as B14
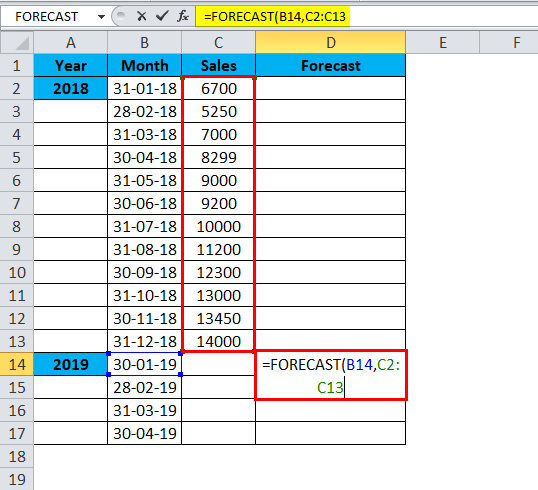
- Select known y’s from C2:C13
- Select known x’s from B2:B13
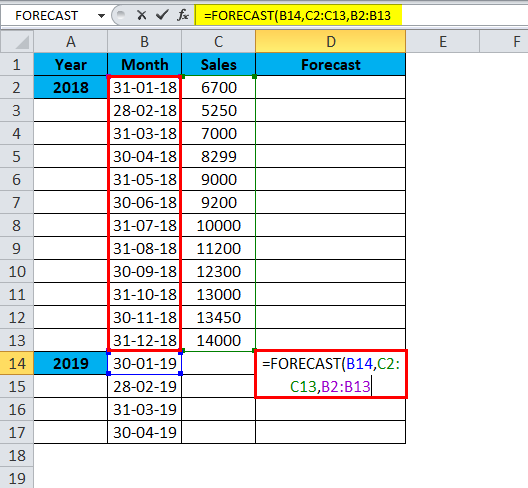
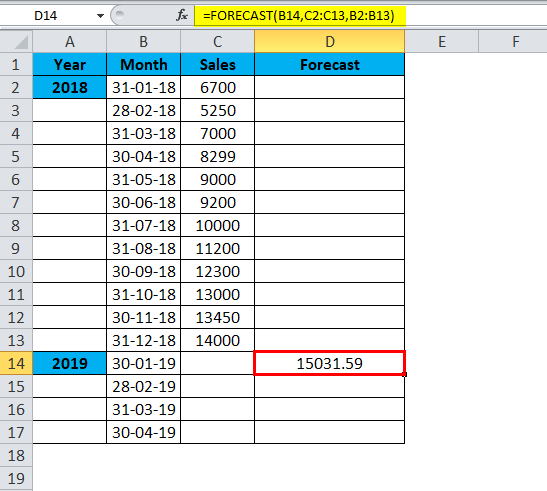
=FORECAST(B14,C2:C13,B2:B13)
The Result is:
Similarly, we find other values
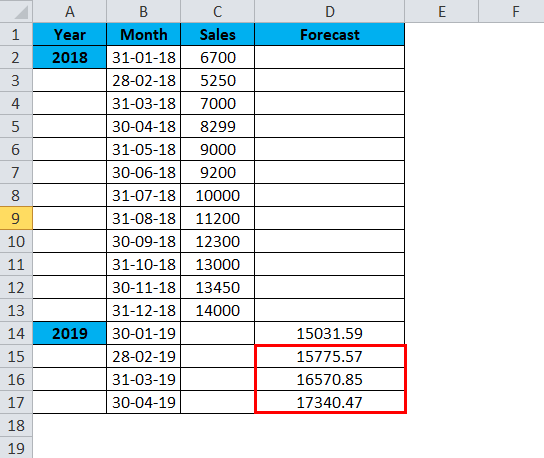
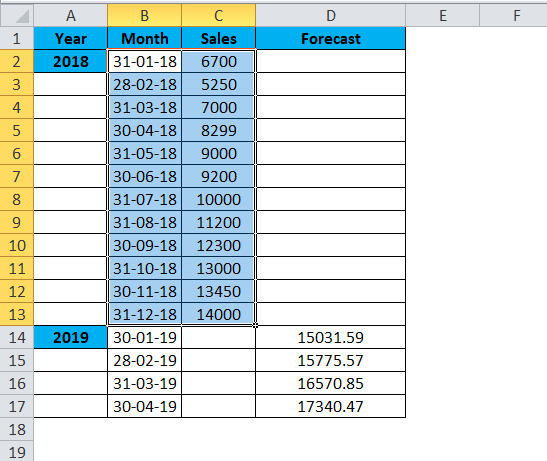
We can see that forecast in excel has predicted some sales values for the year 2019 month-wise, which shows that sales will be increased for the corresponding month.
The above sales and forecasting data can be displayed in a dynamic line chart format to reach management easily.
To insert the line chart, follow the below steps.
- Select the month and sales data column
- Go to the insert menu. Choose a line chart type
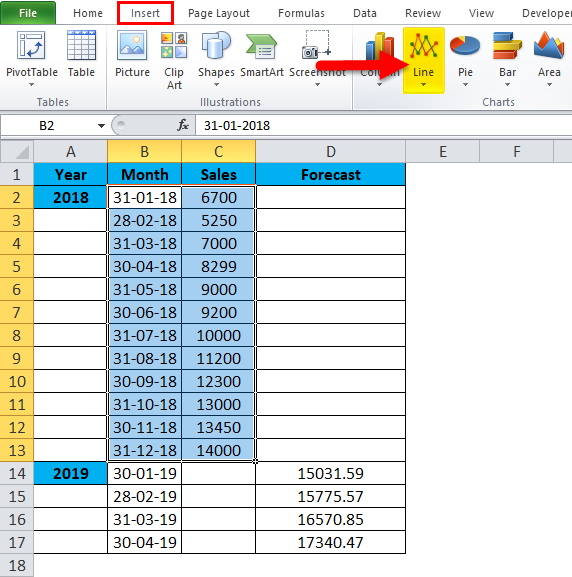
- Select 3D line chart graph format
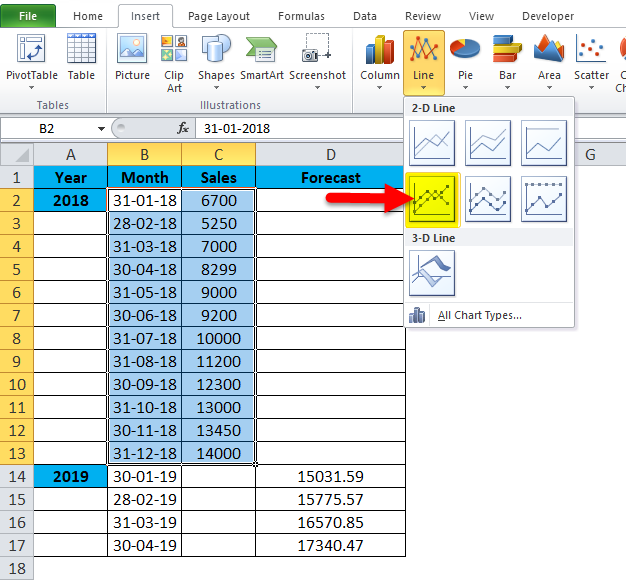
Now select the month and sales data column for graph selection; after that, we need to choose the line chart type, then the line graph chart is displayed below.
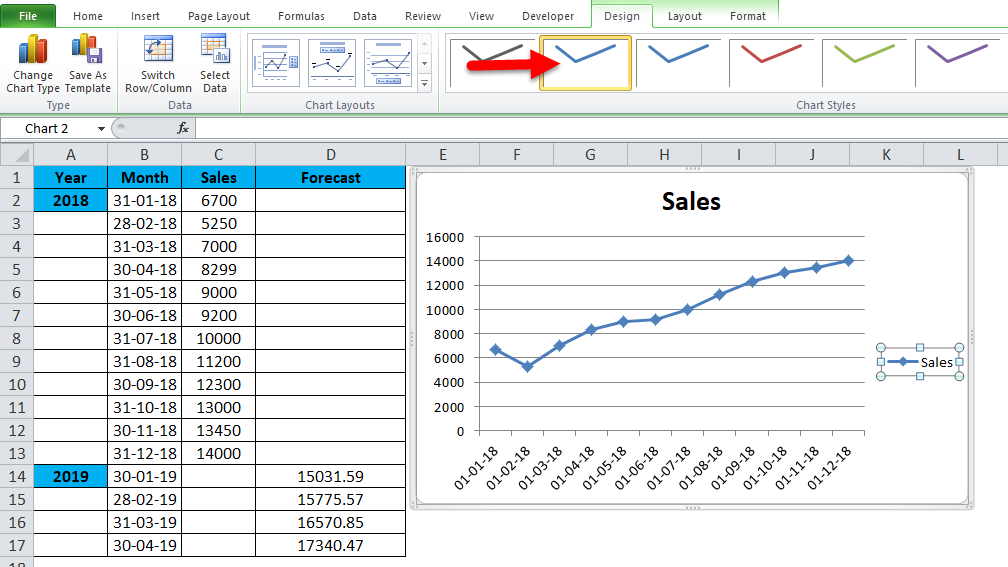
To display the forecast graph, select the forecast column along with the month and sales data. So you will get the below forecasting chart as shown below.
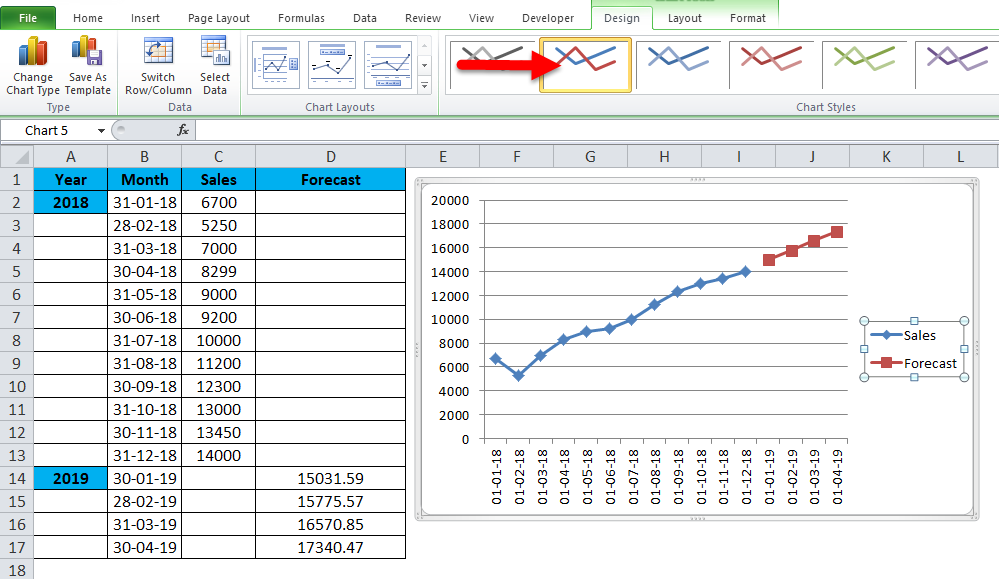
In the above graph, we can see the difference where the blue line shows the previous year’s sales and the orange line shows the future forecasting sales, which denotes that growth will be get increased for the next three months compared to the previous year, 2018
Advantages of using FORECAST in Excel:
- Useful in predicting month wise and year wise sales
- Commonly used in all FMCG, Financial, and Investment companies to determine future sales growth.
Recommended Articles
This has been a guide to the Excel Forecast function. Here we discuss the Forecast Formula and how to use the Forecast function, along with practical examples and a downloadable Excel template. You can also go through our other suggested articles –
