What is F1 Score?
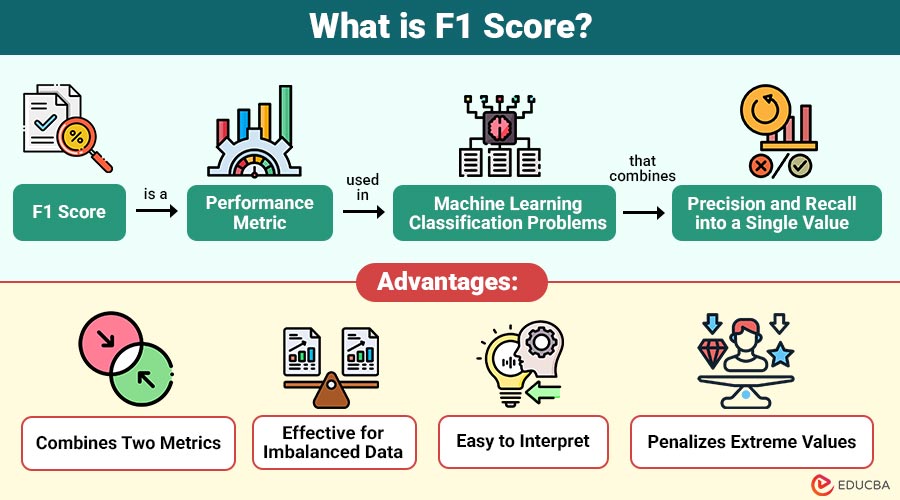
F1 score is a performance metric used in machine learning classification problems that combines precision and recall into a single value. It provides balanced measure of a model’s accuracy, especially when dealing with uneven class distributions.
In simple terms, the F1 score answers this question:
How well does the model balance correct positive predictions and capture all actual positives?
Table of Contents:
- Meaning
- Importance
- Key Components
- Formula
- Interpretation
- When to Use?
- Types
- Example
- Advantages
- Limitations
- Key Differences
Key Takeaways:
- F1 score balances precision and recall, providing reliable metric for evaluating classification models.
- It is especially useful for imbalanced datasets, where accuracy alone can yield misleading performance estimates.
- Higher F1 values indicate better trade-offs between false positives and false negatives in predictions overall.
- This metric uses the harmonic mean, ensuring both precision and recall must be high for better results.
Importance of F1 Score
Here are the reasons that highlight the importance of this metric in evaluating classification models effectively:
1. Balanced Evaluation
Ensures both precision and recall are considered together, providing a balanced performance measure and preventing biased evaluation of classification models.
2. Better than Accuracy in Many Cases
Provides more reliable insights than accuracy on imbalanced datasets, where majority-class dominance can mislead overall performance evaluation results.
3. Useful in Real-World Applications
Widely applied in real-world scenarios like healthcare, finance, and cybersecurity, where accurate classification decisions significantly impact outcomes and risks.
4. Handles Trade-Offs Effectively
Effectively balances trade-offs between false positives and false negatives, helping optimize model performance based on the importance of different error types.
Key Components of F1 Score
To understand this metric, you must first understand two key evaluation measures:
1. Precision
Calculates percentage of all projected positive instances that were accurately forecasted.
2. Recall
Calculates percentage of real positive cases that the model accurately detected out of all positives.
F1 Score Formula
The F1 score is the precision and recall harmonic mean:

Why Harmonic Mean?
The harmonic mean penalizes extreme values more than the arithmetic mean. This ensures that a high F1 score is only achieved when both precision and recall are reasonably high.
Interpretation of F1 Score
The following points explain how to interpret different values:
- F1 Score = 1 → Perfect precision and recall
- F1 Score = 0 → Poor model performance
- Between 0 and 1 → Balanced performance depending on precision and recall
An improved balance between memory and precision is indicated by a higher F1 score.
When to Use F1 Score?
It is particularly useful in following scenarios:
1. Imbalanced Datasets
This method is used when class distributions are uneven, as accuracy can be misleading and unreliable for performance evaluation.
2. Unequal Cost of Errors
Useful when the effects of false positives and false negatives differ, necessitating a fair assessment of both errors.
3. Binary Classification Problems
Commonly applied in binary classification tasks like spam detection, fraud detection, and medical diagnosis problems.
Types of F1 Score
Depending on the problem, it can be calculated in different types:
1. Binary
This metric is used for two-class classification problems and measures the balance between precision and recall for a single positive class in predictions.
2. Macro
Calculates independently for each class, then averages them equally, treating all classes with equal importance regardless of size.
3. Micro
Aggregates contributions of all classes by summing true positives, false positives, and false negatives, suitable for an imbalanced dataset evaluation.
4. Weighted
Computes the weighted average for each class based on support, giving importance according to class distribution sizes.
Example of F1 Score Calculation
Let’s consider a simple example:
- True Positives (TP) = 40
- False Positives (FP) = 10
- False Negatives (FN) = 20
Step 1: Calculate Precision
Precision = 40 / (40 + 10) = 0.80
Step 2: Calculate Recall
Recall = 40 / (40 + 20) = 0.67
Step 3: Calculate F1 Score
F1 Score = 2 × (0.80 × 0.67) / (0.80 + 0.67) ≈ 0.73
This indicates a moderately beneficial balance between precision and recall.
Advantages of F1 Score
Here are the key advantages that make this metric a valuable measure for evaluating classification model performance:
1. Combines Two Metrics
Provides a thorough assessment of the classification model’s performance by combining precision and recall into a single score.
2. Effective for Imbalanced Data
Performs well when class distributions are uneven, offering a reliable evaluation compared to accuracy on skewed datasets.
3. Easy to Interpret
Provides a single, clear score that simplifies comparison across different models and supports decision-making.
4. Penalizes Extreme Values
Uses the harmonic mean to reduce the impact of very high or very low precision or recall values, making sure the model performs well on
Limitations of F1 Score
Here are key limitations that should be considered when using this metric for model evaluation:
1. Ignores True Negatives
Does not consider true negatives, which may be important in certain classification scenarios and evaluations.
2. Not Ideal for All Problems
This approach may not always be appropriate for balanced datasets, where accuracy alone may not provide a sufficient measure of overall model performance.
3. Can Be Misleading Alone
Using only this metric without other evaluation measures may give an incomplete or misleading understanding of model performance.
4. Less Informative for Multi-Class Without Context
Different averaging methods for multi-class problems can yield different results, making interpretation less straightforward.
Key Differences
Here is a comparison highlighting the key differences between F1 score and accuracy in model evaluation:
| Aspect | F1 Score | Accuracy |
| Definition | Harmonic mean of precision & recall | Ratio of correct predictions |
| Best Use Case | Imbalanced datasets | Balanced datasets |
| Considers False Positives/Negatives | Yes | Not explicitly |
| Reliability | High for skewed data | Can be misleading |
Final Thoughts
The F1 score is an essential machine learning metric that balances precision and recall to evaluate model performance effectively. It is particularly useful for imbalanced datasets and critical error scenarios. Despite its limitations, it remains widely used to capture trade-offs between false positives and false negatives, helping build accurate and reliable predictive models.
Frequently Asked Questions (FAQs)
Q1. What is a good F1 score?
Answer: A good F1 score depends on the problem, but values closer to 1 indicate better performance.
Q2. Why is the F1 score better than accuracy?
Answer: It provides a balanced evaluation, especially for imbalanced datasets.
Q3. Can the F1 score be used for multi-class problems?
Answer: Yes, using macro, micro, or weighted averaging methods.
Q4. What happens if precision is high and recall is low?
Answer: The F1 score will decrease, reflecting an imbalance in performance.
Recommended Articles
We hope that this EDUCBA information on “F1 Score” was beneficial to you. You can view EDUCBA’s recommended articles for more information.
