Updated October 18, 2023
Difference Between EPS vs Diluted EPS
In Basic EPS vs. Dilutes EPS, basic EPS shows how much profit an investor earns if they own a single share of the company. In contrast, diluted EPS measures the profit if we convertible securities (bonds, preferred shares, etc.) into common shares.
In short, it can be said that basic EPS is a straightforward measure as compared to diluted EPS. Nevertheless, the calculation of EPS and diluted EPS and the difference between them is an essential metric for an investor as both are equally critical for the fundamental analysis of a company.
What is Earnings Per Share or EPS?
EPS helps measure the amount of profit a company generates on a per-share basis. Unlike diluted EPS, this simple EPS doesn’t consider the dilutive effects of convertible securities, employee stock options, debt, warrants, etc., in its calculation.
The dilutive effects of the convertible securities occur when the number of outstanding shares increases through the issuance of new shares due to the conversion of other securities into equity. In short, when a company issues more shares, it increases the number of outstanding shares, eventually adversely impacting its EPS. It can also decrease the company’s share price in the short term.
To calculate the EPS of a company, any preferred dividend during the year is deducted from the company’s net income, and the result is divided by the weighted average number of outstanding shares. The weighted average number of shares refers to the measurement of the year-end number of outstanding shares that investors use to monitor the cost basis of the shares accumulated during a year.
Mathematically, the formula for the calculation of EPS represents as,
What is Diluted EPS?
On the other hand, diluted EPS is a financial metric employed by investors in the fundamental analysis of a company to gauge its quality of EPS, taking cognizance of all convertible securities that may exercised in the future. Convertible securities refer to all convertible debt, preferred shares, equity options, warrants, etc.
To calculate diluted EPS, it is critical to identify the dilutive effects of all the convertible securities that can result in more outstanding shares in the future. Like basic EPS, diluted EPS is calculated by deducting any preferred dividend from the company’s net income and dividing the result by the aggregate number of outstanding common shares and convertible securities (such as convertible shares, warrants, options, etc.).
Mathematically, the formula for the calculation of diluted EPS represents,
Head-to-Head Comparison Between EPS vs Diluted EPS
The top five differences between EPS and diluted EPS are as follows:
EPS vs Diluted EPS – Key Differences
The following are some of the key differences between basic EPS and diluted EPS:
- Although basic EPS is simple and easy to use, people do not consider it a good metric to gauge a company’s financial health. On the other hand, diluted EPS is a relatively stricter approach to assessing a company’s financial performance.
- The metric of basic EPS is primarily helpful in gauging the financial health of companies with a simple capital structure. On the other hand, diluted EPS gives a better idea of the financial standing of companies with more complex capital structures as it considers the dilutive effects of convertible securities. In most cases, diluted EPS is more meaningful for large companies since they have potential diluters.
- Diluted EPS is invariably lesser than basic EPS because all the convertible securities are summed with the outstanding number of shares and form the denominator in the calculation for diluted EPS.
- Basic EPS overlooks the negative impact of equity dilution on per-share profitability, while diluted EPS accounts for it effectively.
Comparison Table Between EPS vs Diluted EPS
Let’s discuss the top comparison between EPS vs diluted EPS
| Basis For Comparison | EPS | Diluted EPS |
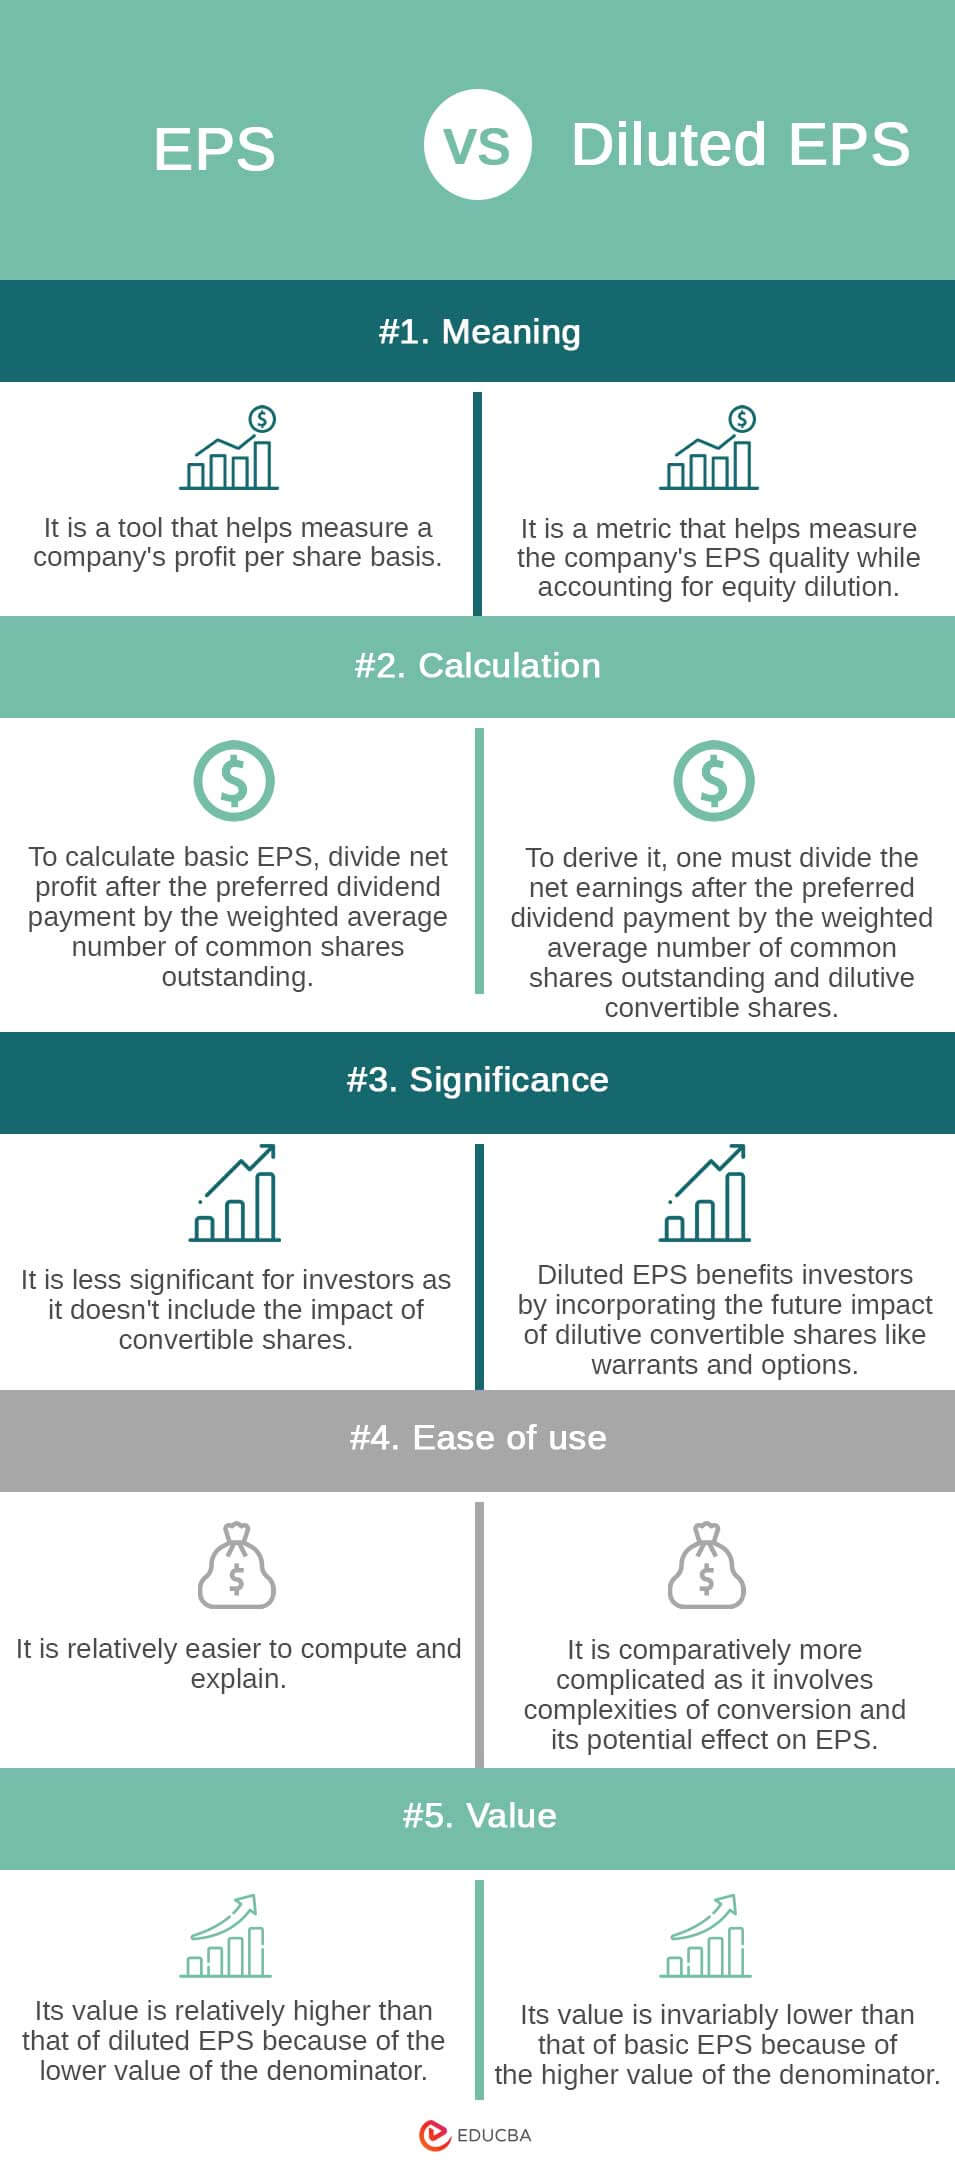
| Meaning | It is a tool that helps measure a company’s profit per share basis. | It is a metric that helps measure the company’s EPS quality while accounting for equity dilution. |
| Calculation | To calculate basic EPS, divide net profit after the preferred dividend payment by the weighted average number of common shares outstanding. | To derive it, one must divide the net earnings after the preferred dividend payment by the weighted average number of common shares outstanding and dilutive convertible shares. |
| Significance | It is less significant for investors as it doesn’t include the impact of convertible shares. | Diluted EPS benefits investors by incorporating the future impact of dilutive convertible shares like warrants and options. |
| Ease of use | It is relatively easier to compute and explain. | It is comparatively more complicated as it involves complexities of conversion and its potential effect on EPS. |
| Value | Its value is relatively higher than that of diluted EPS because of the lower value of the denominator. | Its value is invariably lower than that of basic EPS because of the higher value of the denominator. |
Conclusion
Basic and diluted EPS metrics aid investors in assessing a company’s worth, performance, and profitability. Identifying the difference between these two numbers interests investors. Considerable variations often make investors avoid stocks susceptible to significant share price devaluation due to equity dilution.
Recommended Articles
This is a guide to EPS vs diluted EPS. Here, we discuss the EPS vs diluted EPS differences with infographics and a comparison table. You may also have a look at the following articles to learn more –

