Updated March 15, 2023
Overview of DBMS ER Diagram
ER diagram in dbms stands for entity relationship, which helps us to understand the relationship between the different tables. ER diagram gives us the overview or we can say a high overview of our database. ER diagram shows relationship by using different types of attributes which makes it easy to understand. It also supports various kinds of mapping among the tables. For example, we have an Oracle database which automatically creates the Er diagram for us once we are done with the table creation. In the coming section of the tutorial, we will have closer look at the internal implementation and work in detail for better clarity and understanding.
DBMS ER Model
ER model is the high-level data model which helps developers to understand the relationship among various tables based on the attribute. On this basis, we can easily create relations among backend code as well because we have to map our entity with the objects in code. ER model consists of various components which are as follows;
• entity
• Attribute
• Relation
This ER diagram is used to represent the relation and data elements. It helps us to visualize our database, and gives us a conceptual view for it, also makes it easy to understand at high level. With the help of this, we can easily represent our database as a simple diagram which is called an entity-relationship diagram.
Let’s quickly discussed about the entity of the Er diagram in detail of better clarity see below;
Entity : Entity is nothing but the table which consist of attribute called as columns. In ER diagram we have basically two types of entity weak and strong entities let’s take and a closer look at each of them;
1) Weak entity : An entity which is dependent on the other entity or the parent entity is often termed as a Weak Entity. We can represent this entity by using double square;
Representation:

2) Strong entity: the entity which does not depend on any other entity for their existence is often termed as a strong entity. we can represent this entity using a square. below see the representation.
Representation:

Why Use ER Diagrams in DBMS?
We use ER diagram for so many different reason, out of which few are described below;
Gives us the logical view of our Database.
Helps us to visualize the database.
Helps us to determine the relationship among different tables by making use of attribute, relation and entity.
Give high level view of the database, also specify the what kind of data we will store.
Attribute dbms ER diagram
Attribute in ER diagram can be represented by using the oval shapes but this further gets divided into the various form which we are going to discussed below with representation in detail.
1) Simple attribute: A simple attribute is consist of one value, we cannot divide those attribute into multiple values. It means it is atomic value attribute, let’s take an example of employee salary which we cannot divide into two or more parts. So this type of attribute is called ‘Single Attributes’ in er diagram.
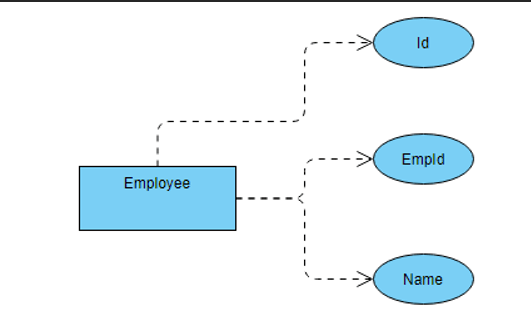
2) Key attribute: This attribute helps us to uniquely identified an entity, by the use of this we can easily identify a unique record from the list of records we have. Let’s understand by one example we have student roll number which can easily use to identify a particular student from the list of students we have. Also this type of attribute are represent by using the ‘oval’ shape in the representation.
Key attribute representation:
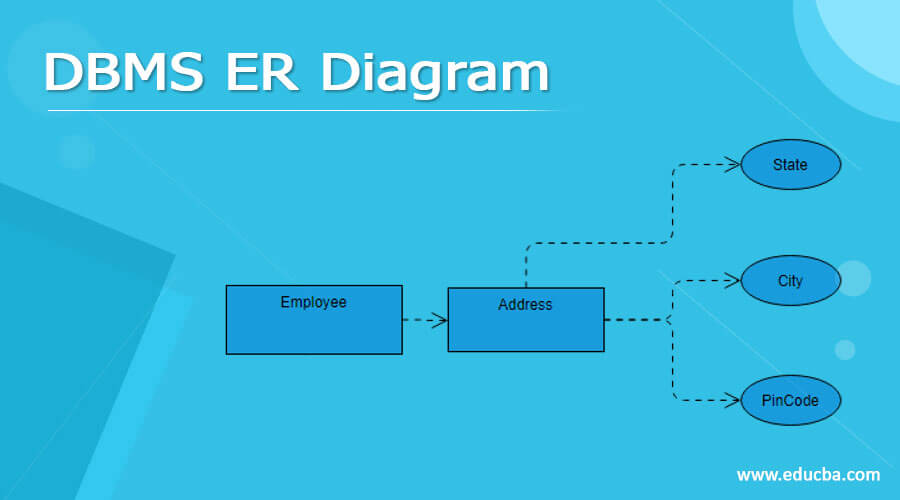
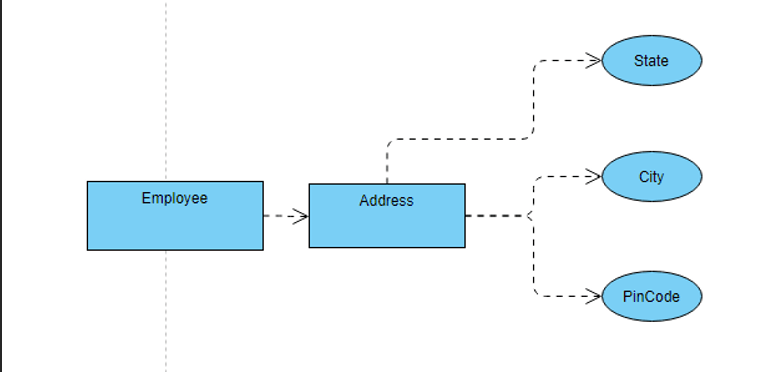
3) Composite attribute: it consists of multiple attributes, As the name suggests if the attribute is used to represent by the combining another attribute then it is termed as ‘ composite attribute ‘. That means we can combine two or more attribute on an entity to create this type of attribute in dbms. Let’s understand by the example, in student table, we have student address which can be represented by using the different attribute of the student table like, city, state, pin code, house no etc.
Composite attribute representation:
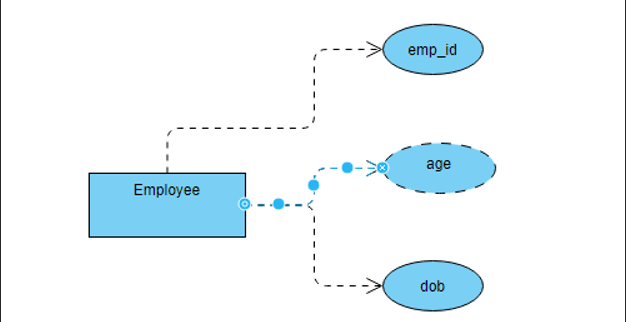
4) Derived attribute: As the name suggests those attributes whose value is derived from the other attribute are termed a derived attributes. Also it is dynamic in nature. we can represent them is ER diagram by using a dashed oval shape. An example of this is ‘age’ of a person can be derived from the ‘dob’ attribute.
Derived attribute representation:
5) Multivalued attribute: Attributes which is representing or created by using one or more attribute termed as ‘Multivalued attribute’ in the entity. This type of attribute can be represented by the use of ‘oval shape’. for example an person can have more than one phone number.
Relationship dbms ER diagram
Relationship in er diagram also knows as the mapping among the tables or entity. In er diagram, we have different types of among which helps us to define and identified how we are string records for a particular table, also the mapping keys easily. In this section we will see the relationship in detail with example see below;
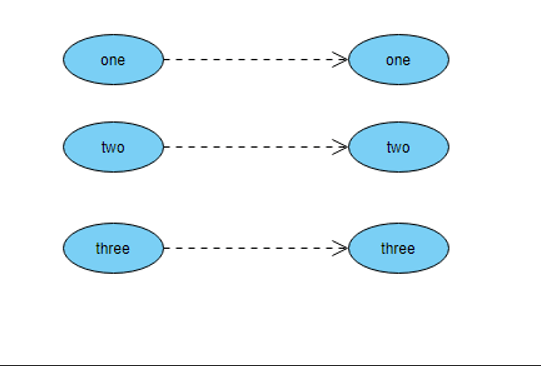
1) one-to-one:
In this type of relationship one attribute of an table can be associate with at most one attribute of the different table. Let’s suppose X entity can be associate with at most one attribute of the other Y entity.
example:
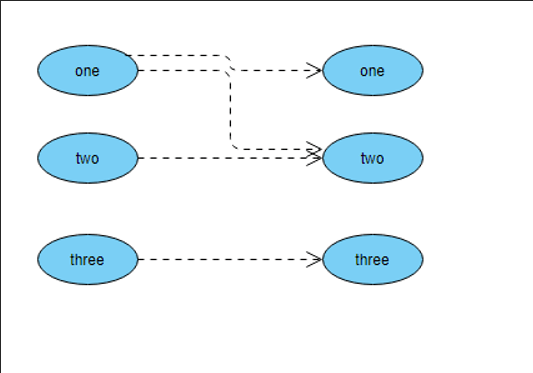
2) one to many:
In this type of relationship one attribute of the first entity associate with the many instances or attributes of the other entity.
example:
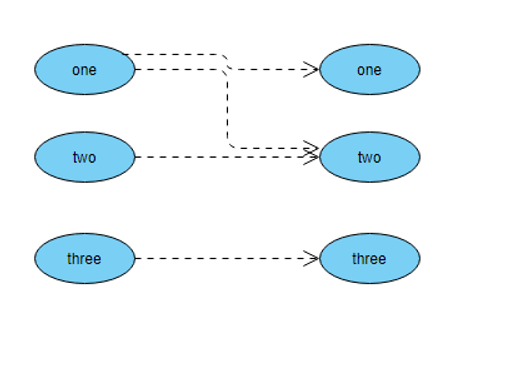
3) Many to one:
In this type of relationship we have more than one instance of the entity that will be associated with the single or one instance of the other entity, then the relation is called ‘Many to one ‘.
example:
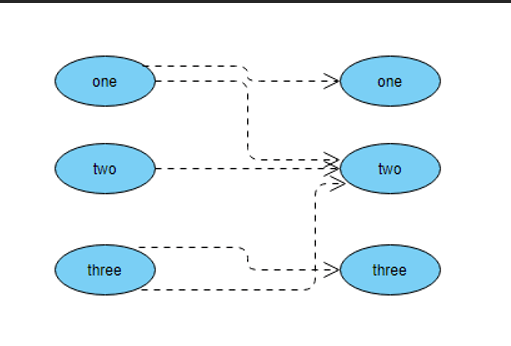
4) Many to Many:
In this type of relationship we can have more than one instance of the single entity can be associate with the more than one instance of the other entity.
example:
Conclusion
By the use of er diagram, we can easily visualize our database with each of the tables define and their relation among different tables. It also identified the weak, string, derived attribute for us just by looking at the diagram. Easy to use, handle and maintainable by the developers as well.
Recommended Articles
This is a guide to DBMS ER Diagram. Here we discuss the Overview, Why Use ER Diagrams in DBMS?, DBMS ER Model for better understanding. You may also have a look at the following articles to learn more –
