


Updated August 15, 2026
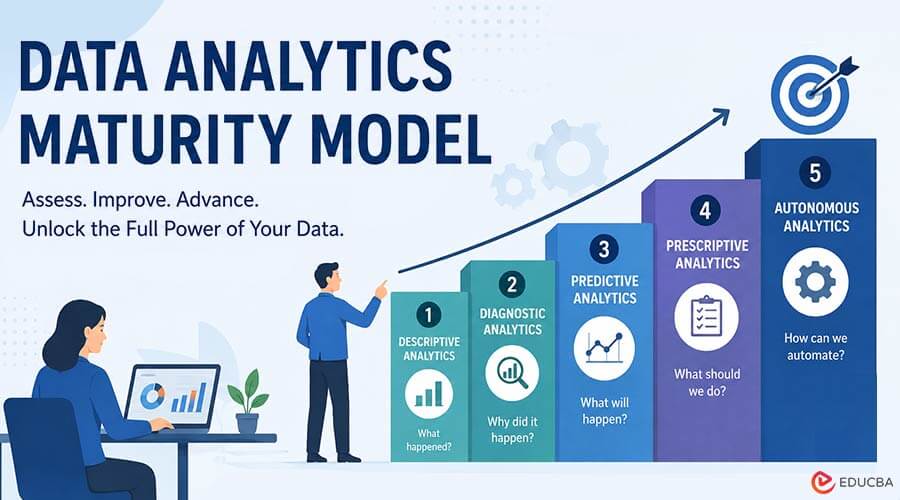
Most companies use data in some form to track performance and support daily decisions. But how they use that data can vary widely. Some rely mostly on basic reports, while others use analytics to predict outcomes and guide next steps. What really sets these organizations apart is how mature their approach to analytics is. A data analytics maturity model helps you understand how well your organization is actually using data right now. It shows you what is working and where the gaps are that genuinely need attention before moving forward.
Knowing your current position helps you make informed decisions about data, technology, and teams before adopting advanced analytics. Build the right capabilities first, and everything else becomes easier to add on top. In this article, we walk through the five stages of analytics maturity and the key areas you can assess to figure out where your company stands.
What Is a Data Analytics Maturity Model and Why Does It Matter?
A data analytics maturity model measures how well a company uses data to make business decisions. It looks at data quality, technology, skills, processes, and how widely analytics is adopted across the organization. An early-stage company might use data mainly for basic reporting. A more mature one can use it to predict what is likely to happen next or even automate certain decisions entirely. Buying a new analytics platform will not solve poor data quality or a lack of skilled people, and that is a mistake many organizations make.
Analytics maturity is about more than the tools you use. Your people, your processes, and your ability to actually turn data into action are just as important as the technology itself. For organizations looking to strengthen these capabilities, data analytics services can provide the expertise and support needed to make better use of data across business functions. With that in mind, here are the five stages and what each one means for your business.
What Are the 5 Stages of Data Analytics Maturity Model?
A data analytics maturity model can be divided into five stages, and each stage shows how a company moves from understanding what happened to making better decisions with data. Let us understand them below.
1. Descriptive Analytics
Descriptive analytics focuses on what happened. It is typically where most organizations begin when they first start building out their analytics capabilities. Businesses use reports and dashboards to monitor performance and track areas such as sales, website traffic, customer activity, and operational results. The main focus is on understanding past and current data.
For example, a bank might use a dashboard to track loan approvals and defaults each month. This helps show changes in financial performance but does not explain why they happened.
2. Diagnostic Analytics
Diagnostic analytics is about understanding the reason behind a result rather than just seeing the result itself. When sales drop or spike, the natural next question is why, and diagnostic analytics helps you answer it. You might look at how performance varied across different regions or product lines to figure out what actually drove the change.
This is where teams stop settling for basic reports and start asking more meaningful questions about what the data is actually telling them. Diagnostic analytics helps businesses uncover the facts behind results instead of just observing them.
3. Predictive Analytics
Predictive analytics shifts the focus to what is likely to happen next rather than what has already occurred. It uses past data to spot patterns that help you make better forecasts. Which customers are showing early signs of pulling away? What might demand look like three months down the road? These are the kinds of questions predictive analytics helps answer before the situation is already sitting in front of you.
The more historical data you have available, the sharper and more reliable these predictions become over time. But it only works if the input data is accurate and you have people who know how to build and maintain the models. Getting either of these wrong can become a problem.
4. Prescriptive Analytics
Prescriptive analytics goes one step further by moving from what might happen to what you should actually do about it. It pulls together historical data, current information, and predictions to recommend a specific course of action. That might be how much inventory to order based on expected demand or the best next step to take in a particular situation your team is navigating.
At this stage, analytics becomes part of daily decision-making, helping teams understand the business and shape how it actually operates.
5. Autonomous Analytics
Autonomous analytics is the most advanced stage in this model. Systems can analyze data and take certain actions with very little human input. This can help with tasks that follow clear rules and need quick responses. For example, a system could detect a change in demand and adjust inventory settings automatically without waiting for someone to step in.
Human oversight still matters here. Not every business decision should be left entirely to an automated system, and the right level of autonomy depends on the risk involved and your business goals.
How Do You Assess Your Company’s Analytics Maturity?
Knowing the five stages of the data analytics maturity model is useful, but you also need to look at the capabilities that support your analytics work. The areas below help you assess where your organization genuinely stands right now.
1. Data Quality and Accessibility
Start with the data itself. Is it accurate and up to date? Can your team access the information they need without depending on another department to hand it over? Are the same metrics defined consistently across your company? Also pay attention to how often your team runs into missing records, duplicate entries, or conflicting figures when two departments report different numbers for the same metric; that is usually a sign that something in how data is managed is not working.
If your employees spend too much time cleaning or finding data instead of using it, that usually signals your analytics foundation needs attention.
2. Technology and Infrastructure
Look at the tools and systems you use to collect and analyze data. Check whether they can support your current needs and your plans. The technology you use should make it easier to bring data together and use it when it is needed.
It is also worth taking a close look at how well your systems are actually working together rather than assuming everything is connected the way it should be. Data spread across disconnected platforms can make analytics slow and messy to work with. A mature setup should allow data to move between systems without creating unnecessary manual work.
3. People and Skills
Analytics also depends on people. Check whether your teams have the skills needed to work with data and actually understand what the results mean. This includes data analysts and engineers, as well as business users who need to work with reports and insights day to day. If your team has a skills gap, you can also hire a data analyst to help teams understand data and use it more effectively in their day-to-day decisions.
You should also look at whether teams know how to bring analytics into their daily work. A company can have strong technology and still struggle if employees lack the skills or confidence to use it well. Training employees properly and giving them clear ownership of their areas helps close the gaps that hold your analytics back.
4. Processes and Governance
Good analytics needs clear processes. You should know who owns important data and who is responsible for checking its quality. There should also be a clear and consistent process for creating reports and approving important data changes.
Governance becomes more important as data use grows. Access rules, security, privacy, and data standards should be part of your normal processes. Without them, even advanced analytics can lead to inconsistent results or create unnecessary data risks.
5. Business Adoption
None of this matters much if nobody actually uses it. So look at how people are working with analytics day to day. Are business teams making decisions based on data, or do they still lean mostly on gut feeling and experience? Check whether your reports are opened regularly and whether they actually push teams to act. If dashboards exist but few people look at them, adding more tools probably would not fix the real issue.
Strong analytics maturity means data is part of everyday decisions, not something teams only check after a problem shows up. McKinsey research found that data-driven companies are 23 times more to acquire customers, 6 times more to retain them, and 19 times more to be profitable. Once you have identified your current maturity level and the gaps holding you back, you can focus on the areas that need the most attention.
How Can You Improve Your Data Analytics Maturity?
Improving data maturity is a step-by-step process. Start with the biggest gaps from your assessment and focus on what matters most. Here are the key steps to help you move forward:
1. Prioritize the Biggest Gaps
Start with the gaps that have the biggest effect on your business. If poor data quality is affecting your reports, then fix that before investing heavily in advanced models. Complex analytics add little value when teams cannot rely on the data behind them. Bacancy Technology has found through its work with clients that steady improvements often deliver better results than trying to introduce advanced analytics before the basics are in place.
2. Set Measurable Goals
Set clear goals for each improvement. Instead of saying you want better data quality, define what better means. You could aim to reduce duplicate records, improve reporting time, or increase the use of trusted dashboards. Your goals should also connect to real business needs. This makes it easier to track progress and see whether your efforts are actually helping.
3. Build Capabilities Step by Step
Once the foundation is stronger, move to the next level. Improve your reporting before moving into deeper analysis. Build reliable forecasting before introducing complex automated decisions. Give your teams time to learn new tools and processes. This makes adoption easier and helps you measure progress as your analytics capabilities grow. From Bacancy Technology’s experience, organizations often get better results when they build these capabilities progressively rather than trying to transform their analytics environment all at once.
4. Improve Data Governance
As your analytics grows, you need clear rules for how you manage data. Define who owns important data and who can access it. Set basic standards for data quality, security, and privacy. Good governance helps teams work with trusted data. It also reduces confusion when different departments use the same information for their reports and decisions.
Final Thoughts
A data analytics maturity model gives you a practical way to understand how your company actually uses data today. It gives you a clearer picture of what is actually working and where the most significant gaps in your analytics capabilities really are. The five stages, from descriptive to autonomous analytics, offer a useful path forward; rather than trying to do everything at once, focus on building what genuinely supports your business goals.
Start with your data, people, technology, and processes. Assess them honestly. Address the important gaps first, then build from there. Over time, this will help your organization move from simply having data to using it naturally in everyday decision-making.
Recommended Articles
We hope this comprehensive guide to the Data Analytics Maturity Model helps you assess your organization’s analytics capabilities and identify areas for improvement. Check out these recommended articles for more insights and strategies to strengthen your data-driven decision-making.