Updated June 3, 2023
Correlation Coefficient Formula (Table of Contents)
What is Correlation Coefficient Formula?
In statistics, specific outcomes directly relate to other situations or variables, and the correlation coefficient measures the direct association of two variables or situations. These variables exhibit a positive correlation coefficient when they simultaneously move in the same direction. If they move in opposite directions, a negative correlation coefficient is present. For example, if the market’s interest rate falls, corporate loans will be cheaper and boost the economy. So the interest rate and growth of the economy have a positive correlation coefficient. The value of the correlation coefficient defines the strength of the relationship between variables. The maximum value of the correlation coefficient varied from +1 to -1. If the correlation coefficient is +1, the variables are positively correlated; if that value is -1, it is called perfectly negatively correlated.
Suppose we have 2 sets of data given by X (X1, X2 … Xn) and Y (Y1, Y2 … Yn).
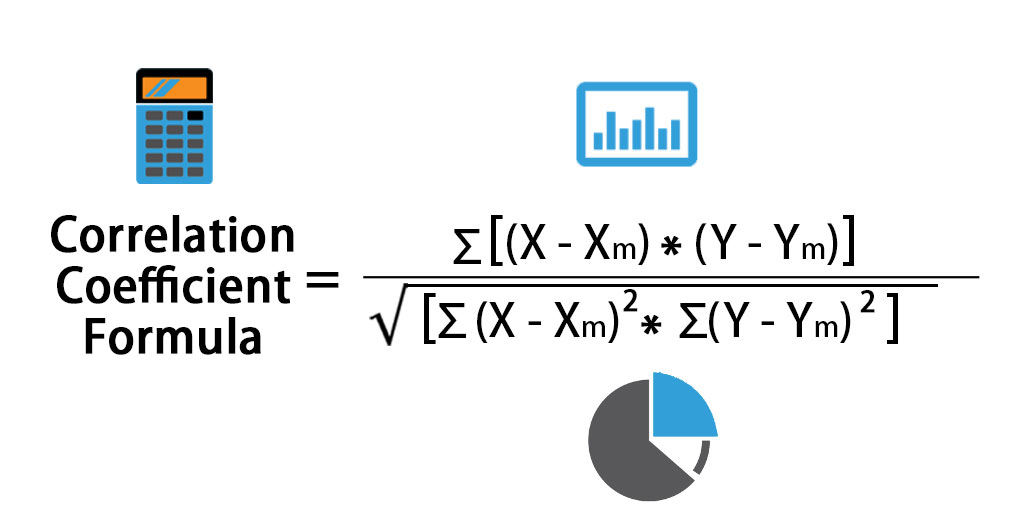
The formula For the Correlation Coefficient is given:
Where:
- X – Data points in Data set X
- Y – Data points in Data set Y
- Xm – Mean of Data set X
- Ym – Mean of Data set Y
This formula seems to be very time consuming and confusing at first.
Another way to calculate the correlation coefficient is using the CORREL () function in Excel. Finally, I will explain both Correlation Coefficient formulas by using examples.
Examples of Correlation Coefficient Formula (With Excel Template)
Let’s take an example to understand the calculation of the Correlation Coefficient in a better manner.
Correlation Coefficient Formula – Example #1
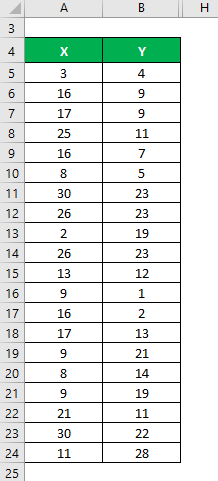
Let’s say we have two data sets, X & Y, each containing 20 random data points. First, calculate the Correlation Coefficient for the data set X & Y.
Solution:
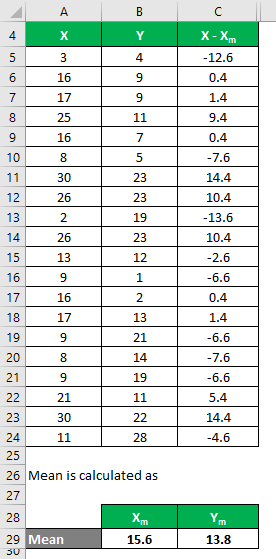
The mean is calculated as follows:
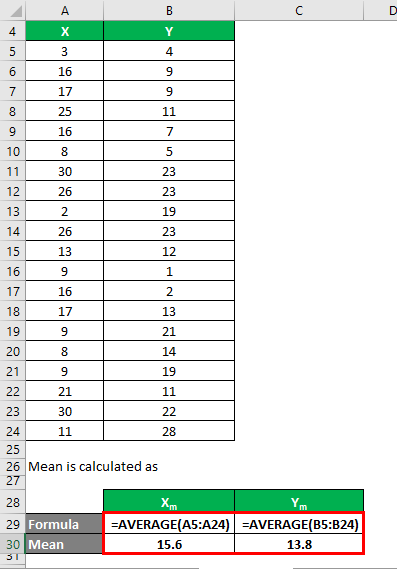
- Mean of Data Set X = 15.6
- Mean of Data Set Y = 13.8
We must calculate the difference between the data points and the mean value.
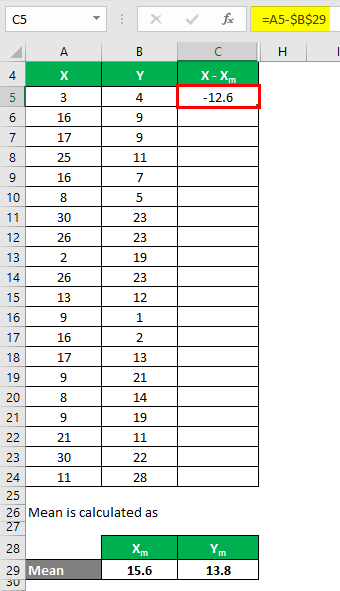
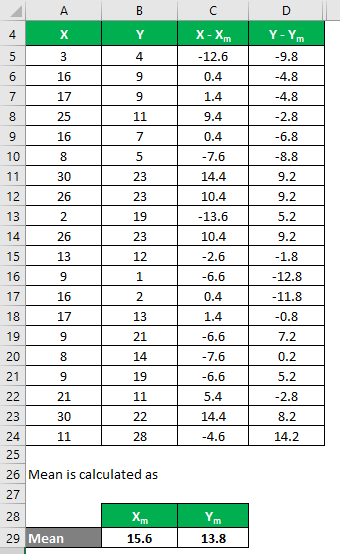
Similarly, calculate for all values of the data set X.
Similarly, calculate all values of the data set Y.
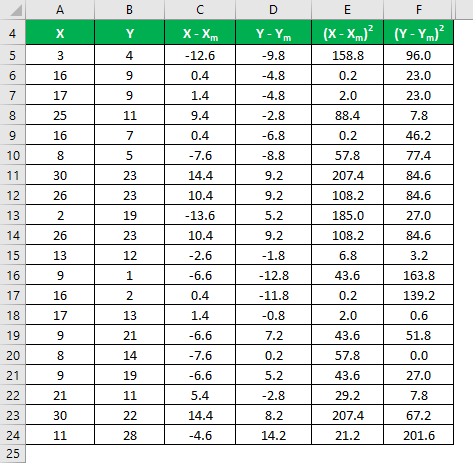
Calculate the square of the difference for both the data sets, X and Y.
Multiply the difference in X with Y.
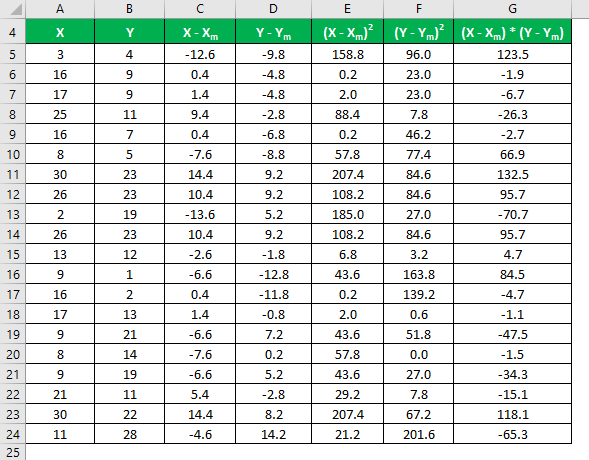
The formula given below calculates the correlation coefficient:
Correlation Coefficient = Σ [(X – Xm) * (Y – Ym)] / √ [Σ (X – Xm)2 * Σ (Y – Ym)2]
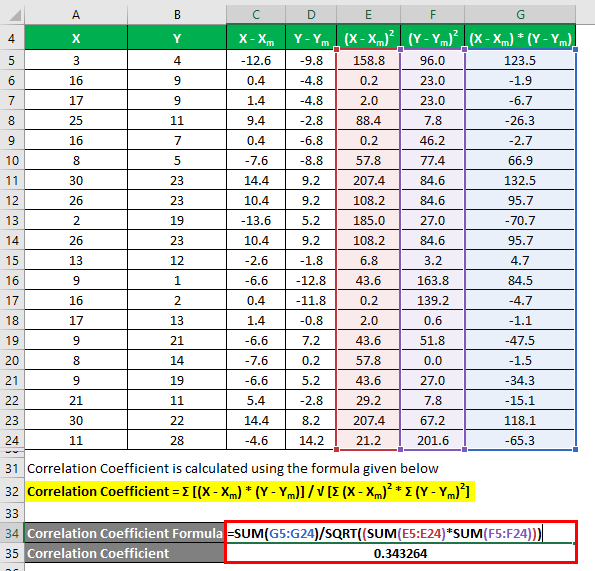
Correlation Coefficient = 0.343264
So it means that both the data sets have a positive correlation and are given by 0.343264.
Correlation Coefficient Formula – Example #2
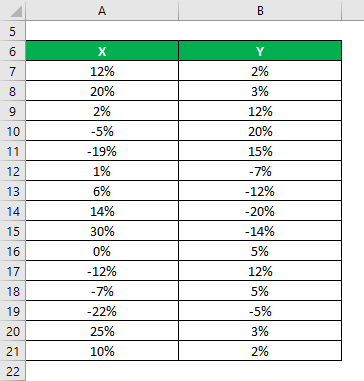
Let’s say you are looking to invest in the stock market and invest in 2 stocks and want to choose those stocks so that your portfolio is diversified. It means that if one gives you a negative return, others will help you to get a positive return and vice versa. So basically, you want to invest in stocks with a negative correlation. You have 2 stocks and have got information on their historical returns for the last 15 years.
Solution:
The correlation coefficient is calculated using the Excel formula.
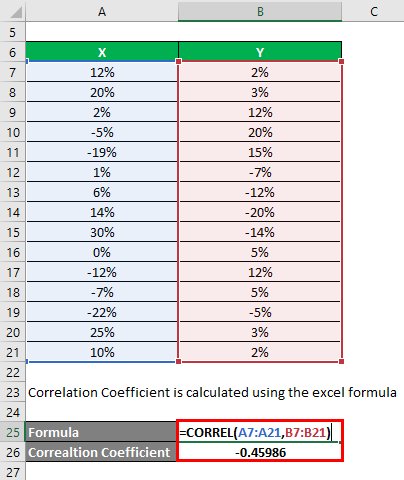
Correlation Coefficient = -0.45986
We have used the CORREL() function of Excel to see the correlation coefficient for the 2 stocks. You see that the correlation function is negative in value, which means that both stocks have a negative correlation. So your choice is apt as per your requirements.
Explanation
We know and discuss that the correlation coefficient measures the extent of the relation between two variables. Still, the catch here is that it can only measure the relationship, which is linear. This tool is not efficient in capturing nonlinear relationships.
Also, there are a few other properties of the correlation coefficient:
- A correlation coefficient is a unit-less tool. This property is beneficial since it allows you to compare data with different units. For example, Stock prices depend on various parameters like inflation, interest rates, etc. So we can use public information to determine the correlation between them.
- As discussed above, its value lies between + 1 to -1. So +1 is perfectly positively correlated, and -1 is perfectly negatively correlated.
Relevance and Uses of Correlation Coefficient Formula
The correlation coefficient helps us better understand the data sets and their relationship and has many applications in finance and economics. Financial institutes, banks, companies, and even governments use correlation coefficients to track historical data, extract meaningful information, and predict market trends efficiently. While the correlation coefficient is a powerful tool, one should not use it in isolation but rather apply it in conjunction with other tools and methodologies. The reason for that is simple; we cannot rely on data, which sometimes gives us insignificant complete information.
For example: If you have collected information and you have got to know that there is a positive correlation between rain and the death of dogs. It means that in the year when the rain was more, a number of dogs died. However, there is a correlation that is not meaningful at all. That is called a spurious correlation. So be very careful while making decisions only based on data.
Recommended Articles
This has been a guide to Correlation Coefficient Formula. Here we discuss calculating the Correlation Coefficient using a formula, practical examples, and a downloadable Excel template. You may also look at the following articles to learn more –
