Updated June 9, 2023
Excel Confidence Interval (Table of Contents)
Introduction to Confidence Intervals in Excel
A confidence Interval is a range of values within which the chance of lying the population parameter is high. Within Excel, we have a CONFIDENCE function that allows us to determine the confidence interval for a population parameter based on the sample data values. This function categorizes within Statistical Functions under Excel and uses the Normal Distribution or approximation towards Normal Distribution while deciding the Confidence Interval for a population parameter.
Confidence intervals are integral parts of Statistical Calculations for an analyst and have a major impact on the decisions he/she makes based on the data. A confidence Interval is an interval (range of values) with high chances of true population parameters lying within it. It seems to be one of the hardest calculations to crack on paper. However, with the help of Excel, you can calculate one with minimal effort and a fuss. In this article, we will take a deep dig and see the process of finding a confidence interval under Excel with the help of some Excel Functions.
Syntax;
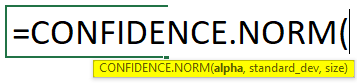
The syntax for the CONFIDENCE function that allows us to find out confidence interval under Excel is as shown below:
=CONFIDENCE.NORM(alpha, standard_dev, size) (If you are using Excel version above 2007) OR
Both these functions work exactly the same and have no difference while calculating the confidence interval. These two functions use Normal Distribution or approximation towards Normal Distribution while calculating the confidence interval.
Arguments:
- Alpha – The formula to compute the required argument, known as the level of significance, is by taking the reciprocal of the Confidence value. Thus, if you want a 95% confidence value, the significance level would be 1 – 0.95 = 0.05 or 5%.
- standard_dev – This is a required argument specifying the sample data’s standard deviation.
- Size – This is a required argument that specifies the number of sample points present within the sample data.
In Statistics, we need to add and subtract the confidence value from the sample mean to find out the confidence interval.
Confidence Interval = Sample Mean ± Confidence Value.
Let’s see how we can find out the confidence interval for a population means based on the sample data provided.
How to Compute Confidence Interval?
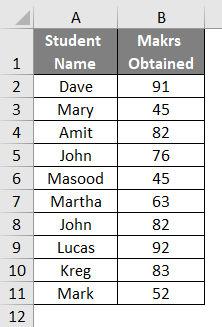
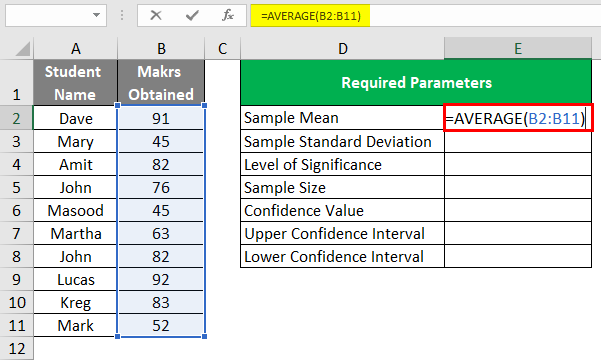
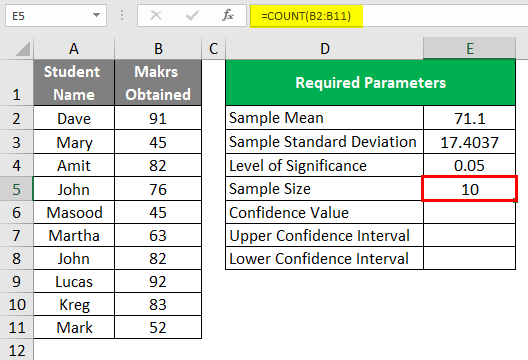
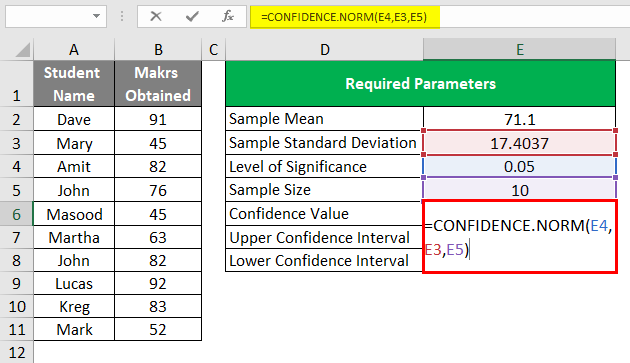
Suppose we have data on marks obtained by 10 students in a class of standard 10th, as shown in the screenshot below. All we need to compute is a Confidence Interval for the men’s population marks based on the sample data of these 10 students. Let’s see how this can be done.
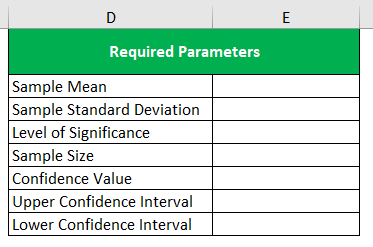
We first need to compute the required parameters for the confidence interval computation. These are namely Mean, Standard Deviation, Significance Value, and Size.
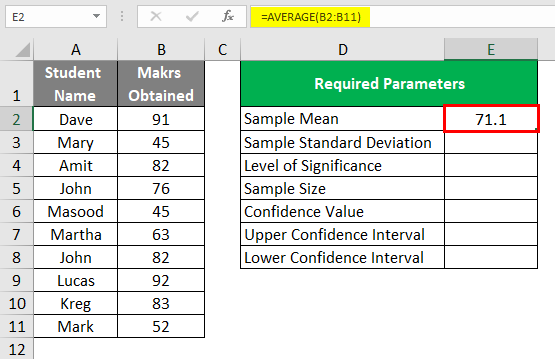
Step 1: In cell E2, use the formula as an AVERAGE to calculate the sample mean. Use formula as =AVERAGE(B2:B11).
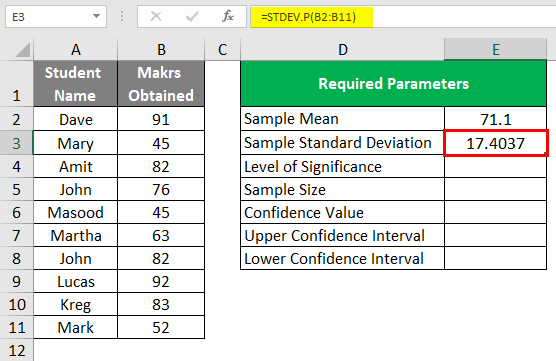
Step 2: To calculate Sample Standard Deviation, use the STDEV.P function in cell E3. Use the formula as =STDEV.P(B2:B11) to capture the standard deviation for data.
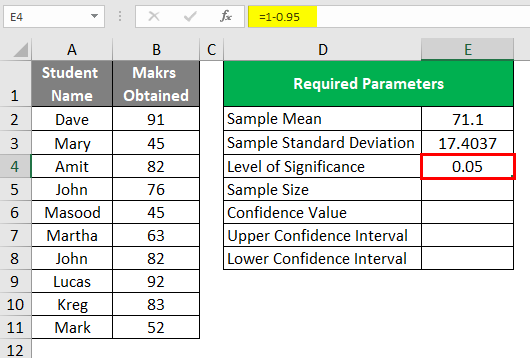
Step 3: We want a 95% confidence interval for the population means, for which we will set the significance level as 1-0.95 = 0.05. Set the value in cell E4.
Step 4: For capturing the sample size, we can use the COUNT function to count the size of column B. use the formula as =COUNT(B2:B11) under cell E5.
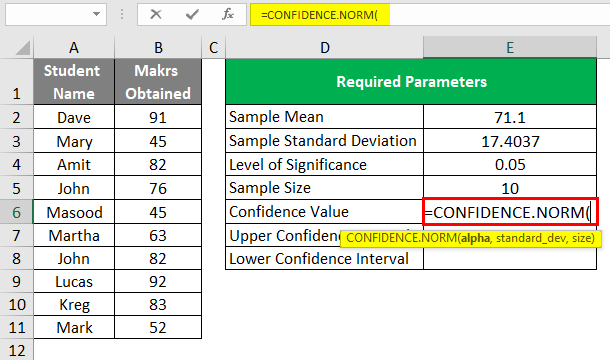
Step 5: In cell E6, we will find the Confidence Value using CONFIDENCE.NORM function. Start initializing the function by typing “=CONFIDENCE.NORM(“in cell E6.
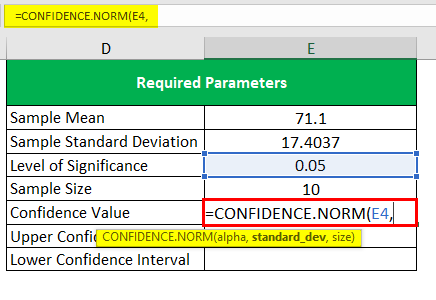
Step 6: The first parameter value is for an alpha, a.k.a. Level of Significance (cell E4). Use E4 as the first parameter for this function.
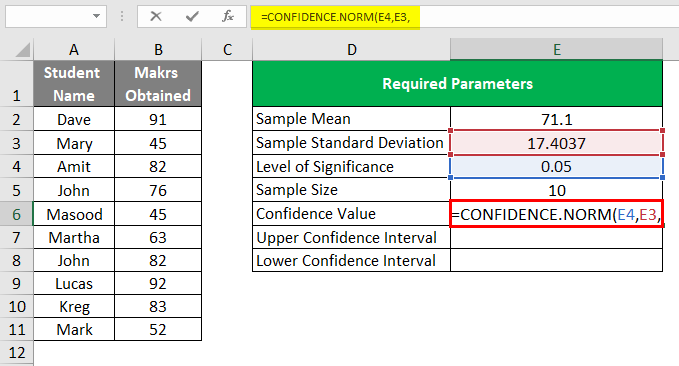
Step 7: Use Sample Standard Deviation as a second parameter under the formula. The value is stored in cell E3. Add it as a second argument under the formula.
Step 8: Sample Size is the last parameter for the function. It is stored under cell E5. Use this cell as an argument in the formula and close the bracket to complete it.
Press Enter key to see the confidence value for this sample data of marks for ten students, as shown below under cell E6.
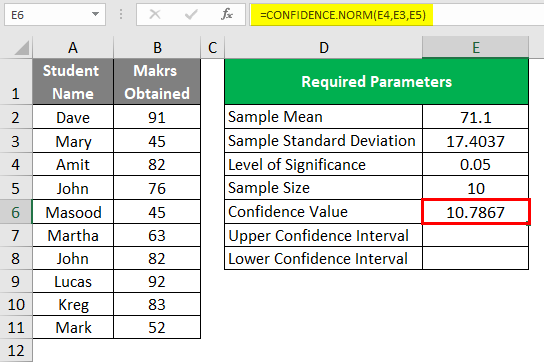
Now, we wanted to find out the value of the Confidence Interval. For this, we need to add and subtract the confidence value from the sample mean, which is captured under cell E2. Those two values will be called Confidence Lower Bound and Confidence Upper Bound.
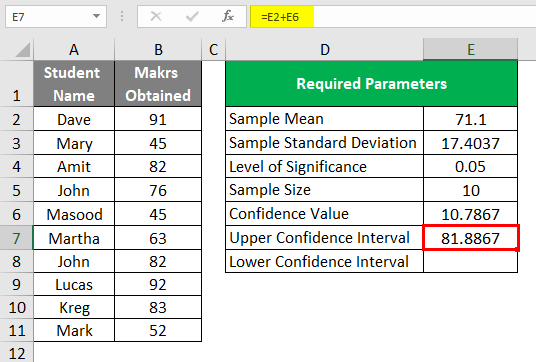
Step 9: Add cell E6 in E2 to get the upper bound for the confidence interval for the population means. Use formula as =E2+E6 under E7.
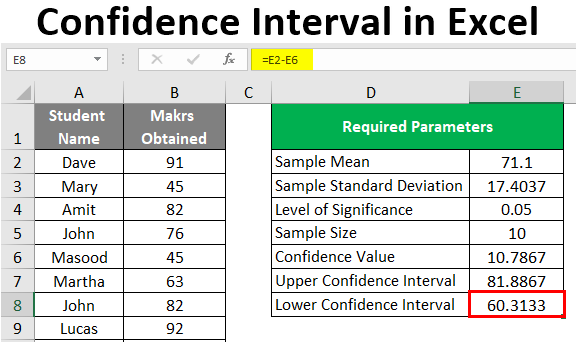
Step 10: Subtract cell E6 from E2 to get the lower bound for the confidence interval for the population mean. Use formula as =E2-E6 under E8.
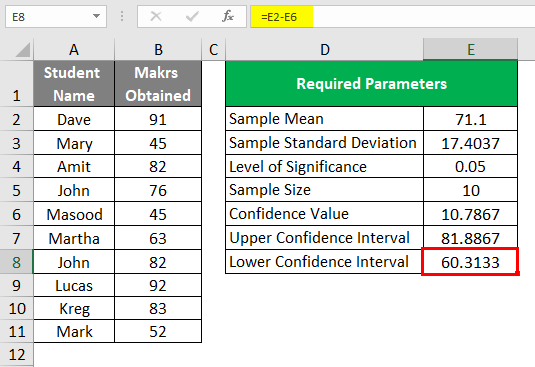
Thus, the 95% Confidence Interval for Average Marks obtained by the population of students based on these ten students is (60.3133, 81.8867). This means that 95 times out of 100, the average mean marks scored will fall between 60.3133 and 81.8867 for the population of students from which these ten students are sampled.
Please note that we can also use the CONFIDENCE function to capture the 95% confidence value for the population mean. As said earlier, these two functions are identical and should give the same value for confidence value (You can give it a try for this and let me know your outputs.
We can calculate a confidence interval under Excel using basic arithmetic and CONFIDENCE.NORM/CONFIDENCE function. This article ends here; let’s wrap things up with some points to be remembered:
Things to Remember
- CONFIDENCE function is replaced by CONFIDENCE.NORM under Excel’s 2010 and later versions. The former is still available in Excel for compatible issues.
- We get #NUM! Error while calculating confidence value using CONFIDENCE.NORM/CONFIDENCE function if any of the three parameters (alpha, standard-dev, size) has a value less than or equal to zero.
- #VALUE! An error occurs when any of the three-argument has been provided with a non-numeric value.
Recommended Articles
This is a guide to Confidence Interval in Excel. Here we discuss How to compute Confidence Intervals in Excel, practical examples, and a downloadable Excel template. You can also go through our other suggested articles –
