Central Tendency Formula (Table of Contents)
What is the Central Tendency Formula?
Central Tendency is the single value that describes the full data set given by finding the central spot of that data set itself. This is often considered as the summary of the statistics or Statically Average since Functionally, it is the simple mathematical value which represents the whole data set.
In statistics, three measures are considered as Central Location identifying measures. They are Mean which nothing but the average, Median and Mode. This cannot be used on any data set type rather it has a certain condition to be used on the particular type of data set. For the unsymmetrical Data distribution, the median can be used. The mode can be used for most categorical data set. However, it always pushes to have more than one value with high frequency as Central Tendency which leads to more confusion. For a normal symmetrical Data set, mean is the measure used. However Symmetrical continuous data set has the same value for the Central Tendency no matter it is Mean, Mode, and Median. There is data type such as normally distributed symmetrical Continuous data, discrete data set, categorical data set, irregular unsymmetrical data, etc.
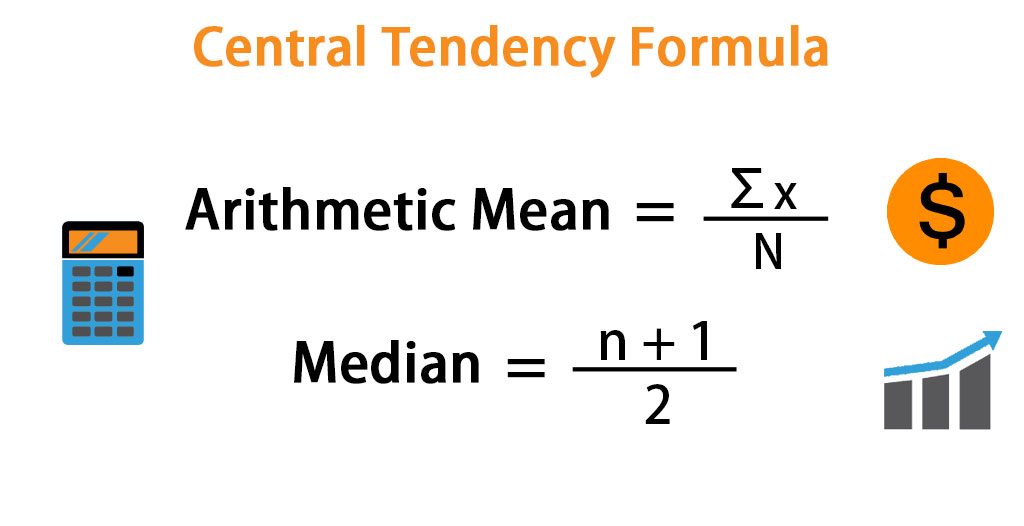
- Arithmetic Mean can be calculated using the following formula.
- Median can be calculated using the following formula.
- Mode is the value which occurs more often in the data set.
Examples of Central Tendency Formula (With Excel Template)
Let’s take an example to understand the calculation of Central Tendency in a better manner.
Central Tendency Formula – Example #1
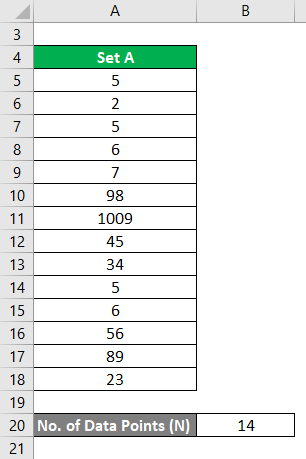
Consider the following Continuous symmetrical normal distributed data set. Calculate the Central Tendency for this.
Solution:
Arithmetic Mean is calculated using the formula given below
Arithmetic Mean = ∑x / N
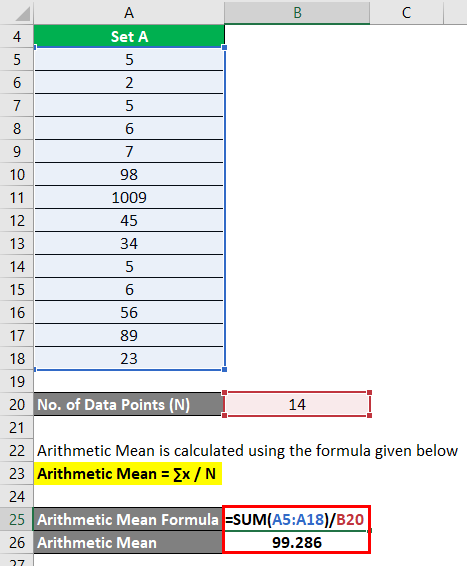
- Arithmetic Mean = (5 + 2 + 5 + 6 + 7 + 98 + 1009 + 45 + 34 + 5 + 6 + 56 + 89 + 23) / 14
- Arithmetic Mean = 99.286
Median is calculated using the formula given below
Median = (n + 1) / 2

- Median = (14 + 1) / 2
- Median = 7.5
Mode is calculated using the excel formula
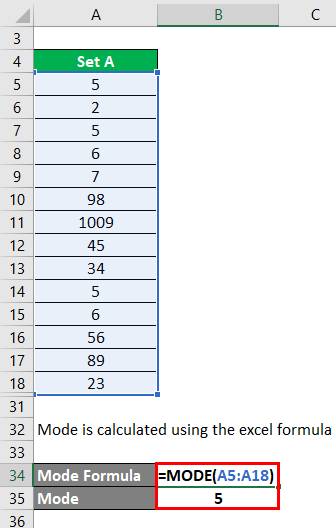
- Mode = 5
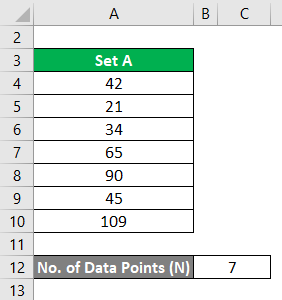
Central Tendency Formula – Example #2
Consider the small data set A= 42, 21, 34, 65, 90, 45, 109. Calculate the Central Tendency for this.
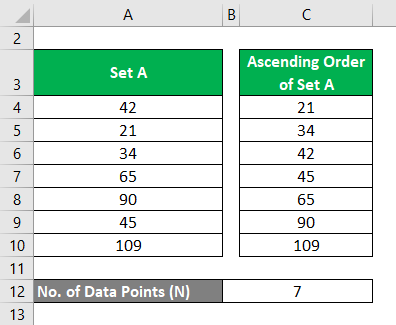
Solution:
Arrange the data set in ascending order.
Arithmetic Mean is calculated using the formula given below
Arithmetic Mean = ∑x / N
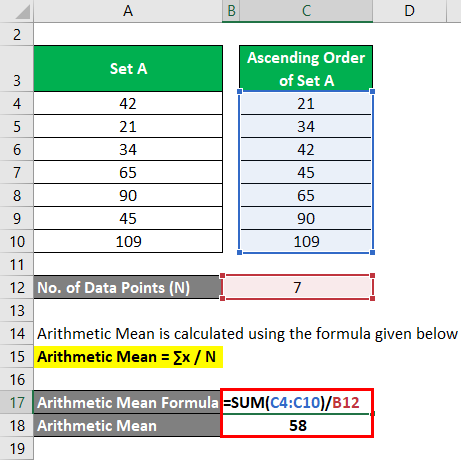
- Arithmetic Mean = (21 + 34 + 42 + 45 + 65 + 90 + 109) / 7
- Arithmetic Mean = 58
Median is calculated using the formula given below
Median = (n + 1) / 2
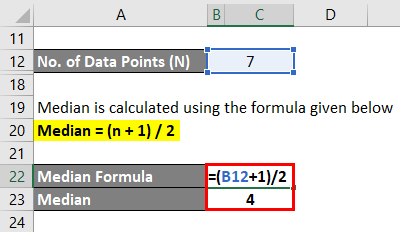
- Median = (7 + 1) / 2
- Median = 4
Mode is calculated using the excel formula
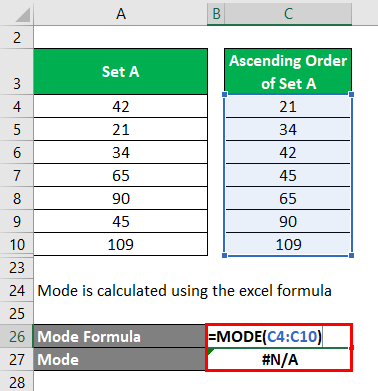
Since there is no repetative value in give dataset, it gives result as a #N/A
Consider the large data set B = 1, 2, 3 …, 51.
Here the total numbers are 51. So n= 51. So Median = 52 / 2 = 26. So the 26th number is the median value. So 25 numbers should be below the median, 26th number is the median and again 25 numbers are above.
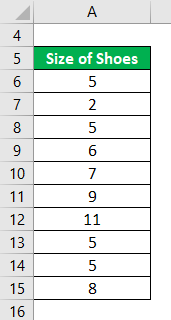
Central Tendency Formula – Example #3
A shopkeeper wants to know the size of the shoes which are sold more often than others. The following is the shoes that are sold recently. 5, 2, 5, 6, 7, 9, 11, 5, 5, 8. Calculate mode using given information.
Mode is calculated using the excel formula
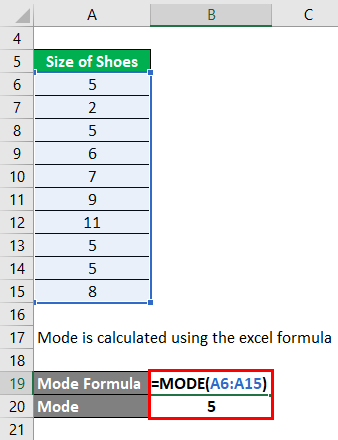
Here 5 is the frequently sold shoe size so Central Tendency is 5. Hence for categorical data, Mode is the measure to be used. Only direct formulas are represented here. More detailed calculations for different data type will be the separate topic one can look at.
Explanation
Mean (Average) Formula:
Step 1: x represents the values present in the data set. ∑x is the Greek variable which represents the summation. Together ∑x is the summation value of all the value present in the data set. Say for example, data set A = x1, x2, x3, x4. Here = x1+x2+x3+x4. Note this value.
Step 2: N is the total number of values available in the data set. If you take the above example, N= 4.
Step 3: Apply the values in the Mean formula.
Arithmetic Mean = ∑x / N
Median Formula:
Step 1: Median is generally for the unsymmetrical data. n is the total number of values available in the data set. If you take the above example, N= 4.
Step 2: Apply the values in the Median formula.
Median = (n + 1) / 2
The value which we get from the above calculation is the position of data where the Median is. However, this is applicable to the data set when total numbers of data in the given set are odd. For the data which has even number of data in that, it is slightly different. We will check this in the example.
Relevance and Uses of Central Tendency Formula
Among these 3 central Tendency formula, Mean is the widely used one since its primary usage of summarising the data and comparing it with other multiple sets of data. It is mostly used stable measure in economic and social studies for statistical calculations. The Median value is a statistical measure used in many real-life scenarios like real estate median price, bankruptcy value, etc. This is very useful when the data set include very high and low values of grouped and ungrouped data sets. Median is simply the point where 50% of the numbers above & 50% of the numbers below.
It is an instinctive centrality that denotes the middle value. This value is very useful in case of a historic data set or data set that comes over time. A mode is used in finding particular with respect to its sizes. For Example, cloth manufacture wants to go with more number of pieces which is of more sale from his production. Say XS, S, M, L, XL are the size of dresses that are produced. But XL and L are the most used dress sizes out of his production. So in this case, a mode is very useful.
Recommended Articles
This is a guide to Central Tendency Formula. Here we discuss How to Calculate Central Tendency along with practical examples and downloadable excel template. You may also look at the following articles to learn more –
