Choosing the Right Business Analysis Tools: Factors to Consider
Picking the right tools is important in business analysis for success. As organizations depend on data-driven insights to make informed decisions, the role of business analysis tools becomes increasingly crucial. However, with plenty of options available, choosing the right tools can be challenging. In this article, we will provide information on all the factors analysts and organizations should consider when selecting Business Analysis Tools. Also, we will explain the role of the Business Analysis Course in understanding and utilizing these tools effectively.
Importance
The analysis tools help businesses collect, examine, and present data in making informed decisions. These tools can be different software programs, systems, and techniques that analysts use to gather and process data efficiently. Each tool in the business analysis process offers a distinct function; some software helps with statistical analysis, while other tools provide easy data visualization. Choosing the right tools provides information for strategic planning and improves businesses’ daily operations in a better way.
Factors to Consider When Choosing Business Analysis Tools
The following are the factors analysts should consider when selecting the right tools for business.
1. Functionality and Features
Analysts need to understand their needs and purposes and accordingly choose the tool that provides those features. Analysts should realize the specific abilities of each tool, like data visualization, statistical analysis, or predictive modeling, for effective analysis.
It’s also important to consider that these tools are simple to use and do not require substantial training.
2. Compatibility and Integration
Analysts should check whether the tools are compatible and will work well with the organization’s current data sources and systems. These compatibility features are crucial to connecting different databases, other software programs, and data formats for efficient data flow and analysis.
Additionally, the tools must seamlessly integrate to ensure easy data flows with other platforms and solutions commonly used within the organization.
3. Scalability and Performance
Scalability comes into play when businesses expand, and their data requirements change according to business analysis solutions.
This feature allows the tools to effectively handle large data sets and complex analytical tasks without sacrificing functionality. Scalability ensures the tools adapt to evolving company needs and future expansion plans.
4. Cost and Licensing
The cost of these tools is an important consideration, especially for smaller businesses with limited budgets. Analysts need to assess the overall ownership cost, including the license fees, maintenance charges, and other related expenses.
It is also important to examine the value of investments in the tools regarding future goals.
5. Support and Training
Adequate support and training are vital for effectively utilizing these tools. When choosing tools, organizations should consider if these tools offer user manuals, technical support, and training materials.
In addition, the tools should have a strong user community or vendor support system that can provide advice and help as required.
6. Security and Compliance
Data security and compliance are important factors for businesses handling regulated or sensitive data. The tools should follow industry best practices and standards and comply with laws like the General Data Protection Regulation (GDPR) and the Health Insurance Portability and Accountability Act (HIPAA).
These will ensure data security, encryption, and proper administration and safeguarding of data assets.
Role of Business Analysis Courses in Tool Selection and Utilization
Business analysis courses are essential for assisting analysts and organizations with selecting and using these tools. The following are some of the important roles of this course in tool selection and its usage.
1. Staying Updated
Business analysis courses provide valuable insight into the most recent developments in the business analysis field. It covers best practices, new technology, and ongoing trends.
This course knowledge will help analysts understand what factors and elements to consider when choosing the right tools to keep up with the constantly changing business environment. It ensures they have the latest information and abilities for their organizations.
2. Practical Learning
These courses often include practical training using various tools and software programs. This hands-on experience allows analysts to improve their skills and gain practical expertise.
It will help them to make informed decisions to choose the right tool for their specific analytical needs aligned with their organization’s requirements.
Tools Used in Management of Business Analysis
Here are the top 6 business intelligence tools that are noticeably different and are the best approach to organizations for substantial business insights.
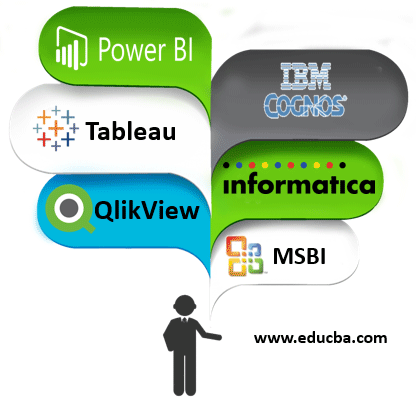
1. Tableau
Tableau is a very simple, yet powerful business intelligence tool for everything to try and do with data and is used and deployed in many enterprises. Tableau lets you create visuals sometimes 10 times quicker than you would have created in other programs and tools. It has very simple drag-and-drop operations to analyze and visualize the solution. Tableau is simply accessible on any device and is a new and adaptive approach to BI for anybody to understand and implement it in an easy manner.
One of the reasons Tableau has grown so popular is that its drag-and-drop interface is relatively simple to use; therefore, users without any programming knowledge can manipulate the data to create interactive visualizations.
- Converts primary data into business insight.
- Simple Drag and Drop
- Tableau offers five main projects: Tableau Desktop, Tableau Server, Tableau Online, Tableau Reader and Tableau Public.
2. Informatica
Informatica is a data integration tool empowering Analytics and visualization. It actually gathers the data from various multiple sources and then loads it into target mappings. Informatica Server is used to extract the data from sources. It consists of one designer who is accountable for creating the mappings between the source and the target. It has its predominant use in integration and services for businesses, industries, healthcare, financial, insurance, and a ton additional.
Informatica allows you to load data. Informatica offers four main software system products: Power Mart, Power Center, Power Connector, and Power Exchange.
- Based on ETL Design and Structure.
- The leader in Gartner Magic Quadrant.
- Gathers data and loads into targets.
- Provides data integration software and service.
3. MSBI
MSBI is an acronym for Microsoft Business Intelligence. It provides complete compositions to work with your BI requirements and needs. It permits users to collaborate and share reports with data in SharePoint, Excel, SQL, etc. It’s additionally capable of manufacturing fast and precise output through significant volumes of knowledge. It also consists of tools that aid in providing effective solutions for business intelligence and data processing queries.
- MSBI is an acronym for Microsoft Business Intelligence.
- Business Intelligence and Data Processing tool.
- Provides optimized solutions for BI queries.
- Uses Visual tools to gain accurate results.
- Divided into three categories – SQL Server Integration Services (SSIS), SQL Server Analytical Services (SSAS), and SQL Server Reporting Services (SSRS).
- SSIS is an integration service, SSAS is an analysis service, and SSRS is a reporting service.
4. IBM Cognos
Cognos is one of the leading technology platforms in today’s world and it permits a user to create, modify, distribute, and schedule reports to totally different communities. It comprises of different products including abilities like dashboarding, Analytics, Visual Image, and Data Integration. It provides intuitive and immersive user experiences mainly focused on analytics and discovery. Cognos has a report studio that is used to create advanced formatting and charting.
The main functionality of IBM Cognos includes IBM Cognos Connection, Insight, Workspace, Report Studio, Event Studio, Query Studio, Analysis Studio, and Microsoft Office. Cognos supports Web Gateways having the default ones as the CGI and ISAPI for delivering faster performance for Microsoft Internet Information Services (IIS).
- Online BI tool.
- It offers a complete array of BI software.
- Provides immersive user experience
5. Power BI
Power BI is a cloud-based business analytics service for analyzing and visualizing data. It produces creative and simple reports and let them publish to a specific organization through Power BI Service. With power bi, anyone can simply create personalized dashboards with a unique view of their business. It is used for intuitive data exploration having a live connection with your data source. Apart from this, power bi has an easy-to-use drag and drop canvas for excellent visualization patterns.
The most valuable and key features for Power BI include Artificial Intelligence with automated machine learning and Azure Machine Learning capabilities, Data Model support with extensible data schemas such as entities, attributes, and relationships, APIs for integration enriching big data support in the Power BI web service, the Power Query data prep for multiple reports, dashboards, and models.
- Cloud-based Business Analytics Service.
- Analyzes and Visualizes the data.
- Capable of creating personalized dashboards.
- Major features – Content Packs, Printing Dashboards, Custom Visualization.
6. QlikView
QlikView is a leading Business Discovery Platform. It has many features that are useful in creating advanced reports and dashboards from multiple data sources. This analytics tool enables users to uncover data insights and relationships across various sources. It has a clear license to in-memory technology that consolidates data from multiple sources to provide centralized data for high-level reporting.
- Leading Business Discovery Platform.
- Broad Data Connectivity for multiple data sources.
- Provides end–to–end platform for Data Integration.
- Data is held in memory for multiple users and for a great user experience.
Final Thoughts
Selecting the right business analysis tools is a critical decision that can significantly impact an organization’s capacity to gather insights and make well-informed decisions. Analysts play a crucial role in this process by considering several variables: cost, support, security, scalability, compatibility, and functionality. Additionally, business analysis courses provide analysts with the necessary information and abilities to effectively help in the tool selection process.
Recommended Articles
This is a guide to Business Analysis Tools. Here we discuss the introduction, Tools used in Management of Business Analysis. You can also go through our other related articles to learn more–

