Updated April 29, 2023
AGGREGATE in Excel (Table of Contents)
AGGREGATE in Excel
Aggregate function comprises multiple mathematical functions such as average, sum, max, min, mean, etc., along with the conditions which are customized for each of these sub-functions available under aggregate function. We can even ignore the different cells or rows, such as a blank row, error value, etc., and get the desired output. We have 19 sub-functions available in the Aggregate function with different Options.
Definition:
“Returns the AGGREGATE in a database of values or list”
It means it performs several calculations (19 Excel statistical functions)
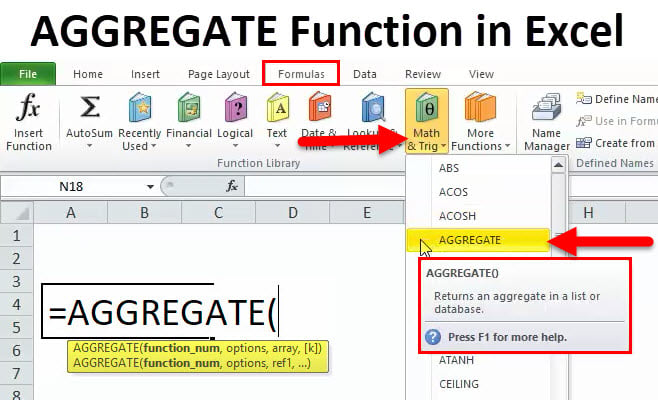
AGGREGATE Formula in Excel
An AGGREGATE function has two types of formula
It can be noticed when you type the AGGREGATE function in an Excel cell
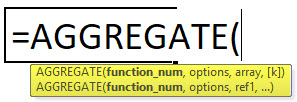
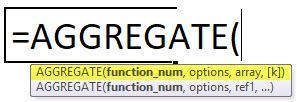
1) AGGREGATE in Reference form
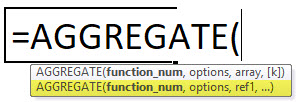
2) AGGREGATE in Array Formula
Function_num: It is a number; it can be from 1 to 19. It depends on which specific function you want to use in the below-mentioned list
Here each number represents a function; it is a compulsory argument
1 to 13 are Reference forms, and 14 to 19 are array form
1: AVERAGE
2: COUNT
3: COUNTA
4: MAX
5: MIN
6: PRODUCT
7: STDEV.S
8: STDEV.P
9: SUM
10: VAR.S
11: VAR.P
12: MEDIAN
13: MODE.SNGL
14: LARGE
15: SMALL
16: PERCENTILE.INC
17: QUARTILE.INC
18: PERCENTILE.EXC
19: QUARTILE.EXC
Options: is the number 0 to 7 that specifies which values to ignore for the aggregate function Note: If the options parameter is omitted, by default, options are set to 0
0: Ignore nested SUBTOTAL and AGGREGATE functions
1: Ignore nested SUBTOTAL, AGGREGATE functions, and hidden rows
2: Ignore nested SUBTOTAL, AGGREGATE functions, and error values
3: Ignore nested SUBTOTAL, AGGREGATE functions, hidden rows & error values
4: Ignore nothing
5: Ignore hidden rows
6: Ignore error values
7: Ignore hidden rows and error values
ref1, ref2, ref[3]: It is the first numeric argument for the function when using the REFERENCE syntax. It is values or numeric values on which we want to perform the computation. You must provide at least two arguments, and you can include additional arguments if needed; or the second reference, Numeric arguments should be between 2 to 253 for which you want the aggregate value
Array: An array refers to a range of cells when using the ARRAY syntax
[k]: The last 6 functions (under 1 to 19 function list): k value as a fourth argument
It is an optional argument used if we need to find out LARGE, SMALL, PERCENTILE.INC, QUARTILE.INC, PERCENTILE.EXC, or QUARTILE.EXC when using the ARRAY syntax
How to Use the AGGREGATE Function in Excel?
This AGGREGATE function is very simple and easy to use. Let us now see how to use the AGGREGATE function with the help of some examples.
Example #1
The following table contains yearly sales data (2015)
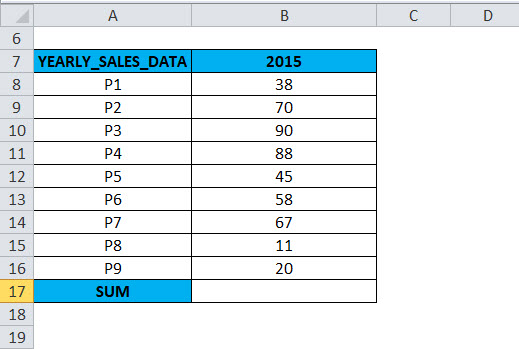
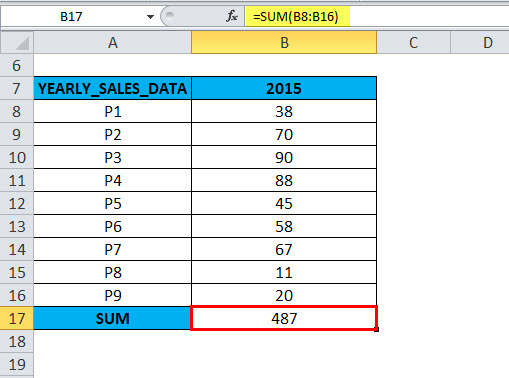
If you run the =SUM (B8:B16) function directly in cell B17,
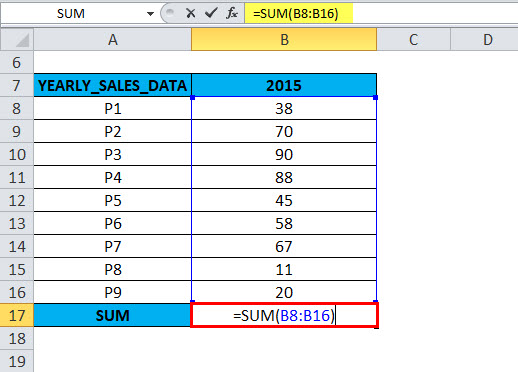
It gives the correct value because that column does not contain hidden rows, errors & nested subtotals
Here will calculate the SUM using an AGGREGATE function in cell B19.
=AGGREGATE(9,4,B8:B16),
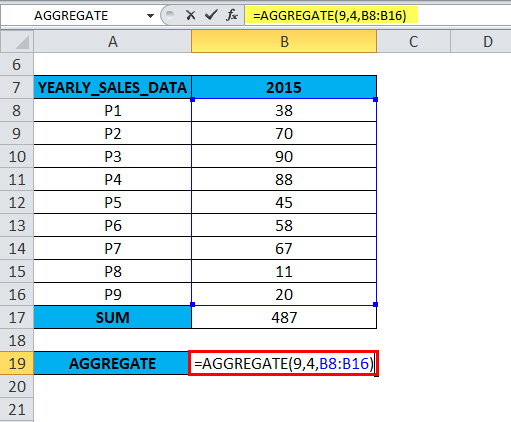
The result will be 487.
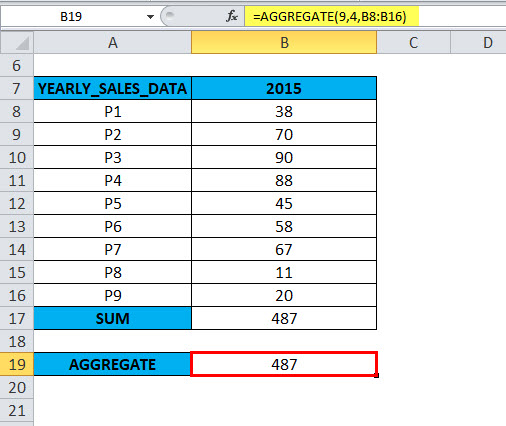
- Function_ num: For the SUM function, the function_ num is 9
- Option: In Column B, i.e. For 2015-year sales data, all values are given, and we won’t have to ignore any values; it does not contain hidden rows, errors & nested subtotals. so we will select Option 4 (ignore nothing)
- Array: is a range for which you want to calculate aggregate functions. Here reference range of values is B8:B16. It is selected as an array of numeric values
- ‘k’ is an optional argument, and is used only for a function like LARGE, SMALL, PERCENTILE.EXC, QUARTILE.INC, PERCENTILE.INC or QUARTILE.EXC. We are calculating the SUM here to omit the value of k.
Example #2
The following table contains yearly sales data (2016)
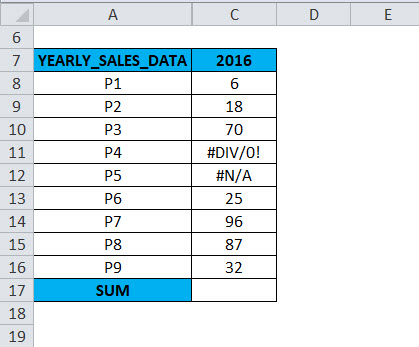
In column C, for the 2016 yearly sales data. In the range C8:C16, a cell C11 & C12 contains an error value (#DIV/0! & #N/A); in the AGGREGATE formula, when an appropriate option is used, the AGGREGATE in Excel gives the correct SUM value, neglecting the error value.
If you run the =SUM (C8:C16) function directly in cell C17,
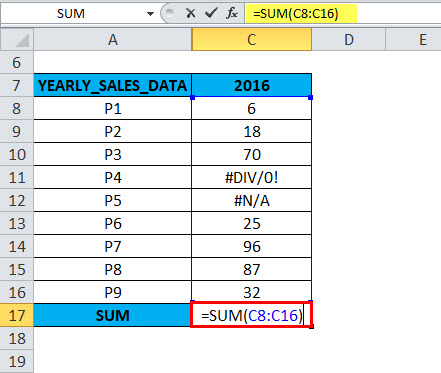
It returns an error value due to an error in that range. Because that column contains #DIV/0! & #N/A errors.
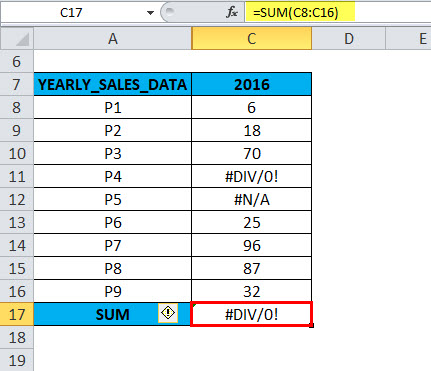
To ignore the error values, we have to use option 6 in an AGGREGATE function
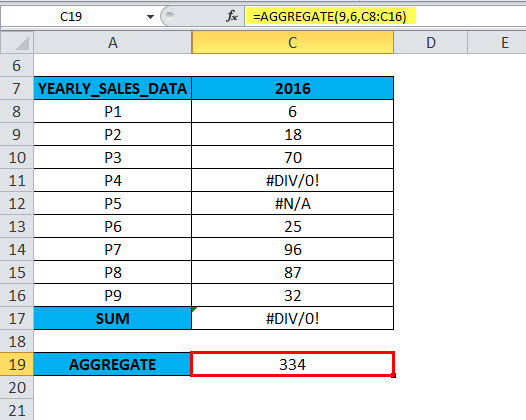
=AGGREGATE(9,6,C8:C16).
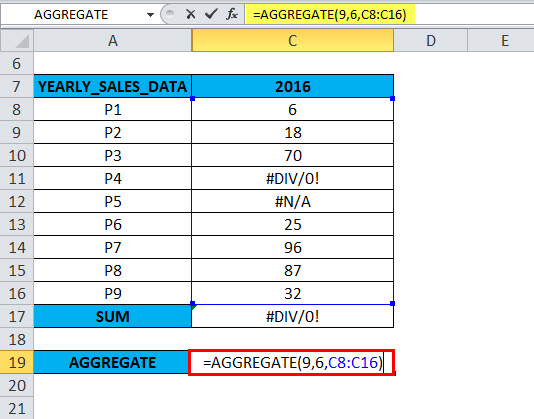
The result or output will be 334.
- Function_ num: For the SUM function, the function_ num is 9
- Option: In Column C, i.e. For 2016-year sales data, In the range C8:C16, a cell C11 & C12 contains an error value (#DIV/0! & #N/A). To ignore these errors, we will select Option 6 (Ignore error values)
- Array: It is a range for which you want to calculate aggregate functions. Here reference range of values is C8:C16. The system has chosen it as an array of numeric values.
- ‘k’ is an optional argument used only for functions like LARGE, SMALL, PERCENTILE.EXC, QUARTILE.INC, PERCENTILE.INC or QUARTILE.EXC. We are calculating the SUM here to omit the value of k.
When an appropriate option is used in the AGGREGATE function, the AGGREGATE in Excel returns or gives the SUM of the remaining values neglecting the error value in cells C11 & C12. i.e. 334
Example #3
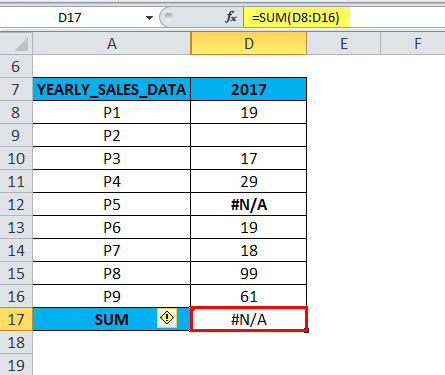
The following table contains yearly sales data (2017)
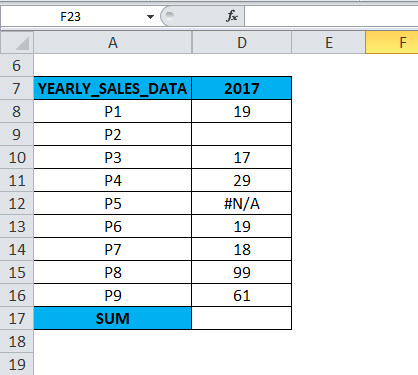
In column D, for the 2017 yearly sales data. In the range D8:D16, cell D9 is a blank cell or hidden row & D12 contains an error value (#N/A). In the AGGREGATE formula, when an appropriate option is used, the AGGREGATE in Excel gives the correct SUM value, neglecting the hidden row & error value.
If you run the =SUM (D8:D16) function directly in cell D17,
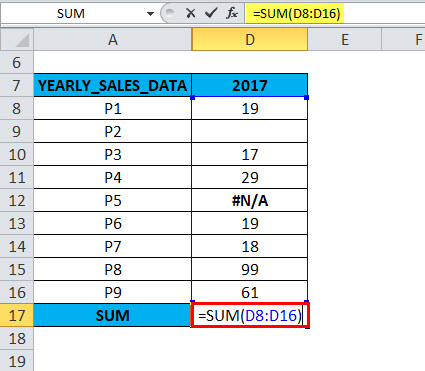
It returns an #N/A error value due to an error in that range. Because that column contains #N/A error & hidden row or blank value.
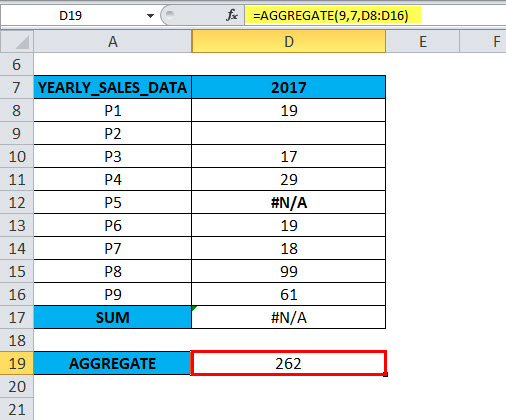
=AGGREGATE(9,7,D8:D16),
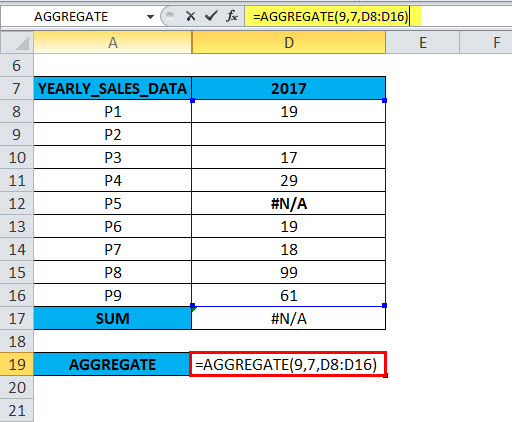
The result or output will be 262
- Function_ num: For the SUM function, the function_ num is 9
- Option: In column D, for the 2017 yearly sales data. In the range D8:D16, cell D9 is a blank cell or hidden row & D12 contains an error value (#N/A). To ignore these errors, we will select Option 7 (Ignore hidden rows and error values)
- Array: It is a range for which you want to calculate aggregate functions. Here reference range of values is D8:D16. It is selected as an array of numeric values
- ‘k’ is an optional argument and is used only for a function like LARGE, SMALL, PERCENTILE.EXC, QUARTILE.INC, PERCENTILE.INC or QUARTILE.EXC. We are calculating the SUM here to omit the value of k.
when an appropriate option is used in an AGGREGATE function, the AGGREGATE in Excel returns or gives the SUM of the remaining values neglecting the error value in cells D9 & D12. i.e. 262
Things to Remember
- The AGGREGATE function is applicable only for vertical ranges or columns of data. It is not designed for horizontal range or rows of data.
- It has a limitation; it only ignores the hidden rows; it does not ignore the hidden columns.
- An AGGREGATE function is applicable only for the numeric value
- Function _ num argument value should not exceed 19 or less than 1. Similarly, for option argument should not be greater than 7; otherwise, it will give #VALUE! error
- In the AGGREGATE function, if in function number argument, if you are using 14 to 19 (LARGE, SMALL, PERCENTILE.EXC, QUARTILE.INC, PERCENTILE.INC or QUARTILE.EXC), the “K” argument should be used. g. =AGGREGATE(15, 6, A1:A9, 3). If the “K” value or second reference argument is ignored, it will result in a #VALUE! error
Recommended Articles
This has been a guide to AGGREGATE Function. Here we discuss the AGGREGATE Formula and how to use the AGGREGATE Function, practical examples, and downloadable Excel templates. You can also go through our other suggested articles –
