


Updated October 27, 2026
What is Skewed Data?
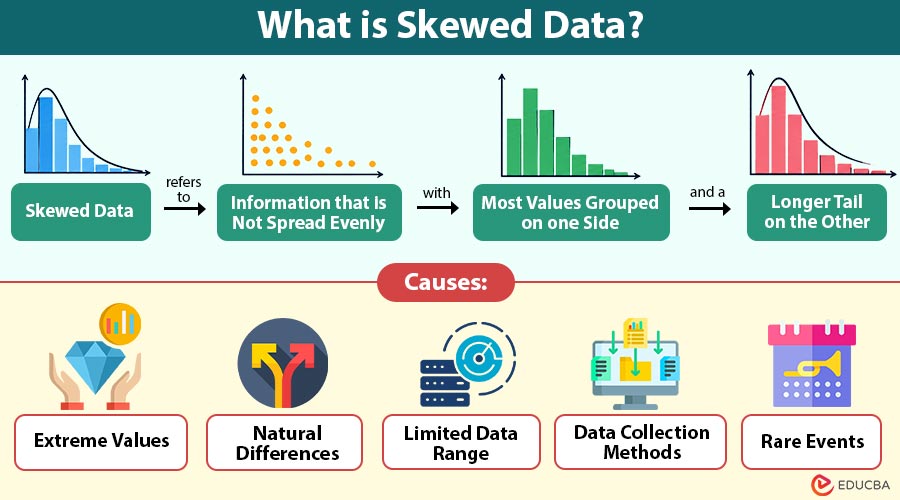
Skewed data refers to information that is not spread evenly, with most values grouped on one side and a longer tail on the other.
When we collect information, we may notice that some values appear more often than others. Sometimes, a few values are much higher or lower than the rest. Think about the salaries of employees in a company. Most employees may earn between ₹20,000 and ₹50,000 per month. However, a few senior managers may earn ₹2 lakh or more.
Because of these higher salaries, the data may stretch more toward the higher side. This creates an uneven pattern called skewed data. Skewed data is common in everyday life. We can see it in salaries, house prices, shopping bills, examination marks, and hospital waiting times. Understanding skewed data helps us read information correctly and make better decisions.
Table of Contents:
- Meaning
- Characteristics
- Types
- Causes
- Examples
- How to Identify Skewed Data?
- Effects of Skewed Data on Data Analysis
- How to Handle Skewed Data?
- Difference
- Applications
- Best Practices
Key Takeaways:
- Skewed data has an uneven distribution, with a longer tail on one side.
- Positive skewness means the longer tail extends toward higher values.
- Negative skewness means the longer tail extends toward lower values.
- Extreme values can affect the average and change how we understand data.
- Charts, the median, and suitable statistical methods help us study skewed data.
Key Characteristics of Skewed Data
Skewed data has several characteristics that make it different from evenly distributed data.
1. Uneven Distribution
Most data values are grouped in one area, while fewer values appear in other areas, making the overall distribution uneven and less balanced.
2. Long Tail
One side of the data stretches farther than the other because a few values are much higher or lower than most other values.
3. Difference Between Mean and Median
The mean and median are often different because a few very high or low values can change the average of the entire dataset.
4. Extreme Values
Some datasets contain very high or low values that are different from most observations and can make the overall distribution more uneven.
5. Asymmetrical Shape
It has an uneven shape because values are not balanced equally on both sides, with one tail extending farther than the other.
Types of Skewed Data
There are two main types. They are based on which direction the longer tail extends.
1. Positively Skewed Data
Positively skewed data is also known as right-skewed data. In this type, most values are smaller, while a few are much larger. These larger values create a longer tail on the right side.
2. Negatively Skewed Data
Negatively skewed data is also called left-skewed data. Here, most values are higher, while a few are much lower. These smaller values create a longer tail on the left side.
Causes of Skewed Data
Data can become skewed for several reasons. Some causes are natural, while others depend on how information is collected.
1. Extreme Values
A few unusually high or low values can stretch one side of the data, making the overall distribution uneven and less balanced.
2. Natural Differences
Income, house prices, and waiting times often show uneven patterns because people have different needs, earnings, experiences, and situations in everyday life.
3. Limited Data Range
Some data values have fixed limits, such as examination marks, which cannot exceed the maximum score and may create an uneven distribution.
4. Data Collection Methods
Collecting information from only certain groups of people can create uneven data that may not accurately represent the entire population being studied.
5. Rare Events
Unusual events, such as very large purchases or unexpected delivery delays, can create extreme values and make the overall data distribution uneven.
Examples of Skewed Data
We can find it in many situations. Here are some examples.
1. Employee Salaries
Most employees earn regular salaries, while a few senior executives receive much higher payments. This often creates positively skewed data.
2. Property Prices
Most houses in an area may have similar prices, but a few luxury homes can be much more expensive. These costly properties may create a longer right tail.
3. Examination Results
When an examination is easy, most students may score high marks, while a few receive low marks. This can create negatively skewed data.
4. Online Shopping
Many customers place small orders, while a few spend thousands of rupees on a single purchase. These large orders may create positively skewed data.
5. Hospital Waiting Times
Most patients may receive treatment within a short time, while some have to wait much longer. These longer waiting periods can create right-skewed data.
How to Identify Skewed Data?
There are several ways to check whether data is skewed. Some methods use charts, while others involve simple calculations.
1. Histogram
A histogram is a chart that shows how often different values appear. If the chart has a longer tail on one side, the data may be skewed.
2. Density Plot
A density plot uses a smooth curve to show how data is spread. An uneven curve may suggest that the distribution is skewed.
3. Box Plot
A box plot shows the middle value, spread, and possible extreme values. Unequal whiskers or an uneven position of the median may suggest skewness.
4. Skewness Value
Skewness measures data distribution using a formula. Positive values indicate right skewness, negative values indicate left skewness, and zero suggests symmetry.
Effects of Skewed Data on Data Analysis
It can affect accuracy of data analysis in several ways. Below are some common effects to consider.
1. Misleading Averages
A few unusually high or low values can change the mean, making it less useful for describing a typical value.
2. Statistical Analysis Challenges
Some statistical methods work best when certain assumptions are met. Strong skewness can sometimes affect their results.
3. Machine Learning Performance
The way that some machine learning models identify patterns and provide predictions may be impacted by highly skewed numerical quantities.
4. Difficult Comparisons
Comparing two datasets using only their averages may give an incomplete picture when their distributions are very different.
5. Interpretation Problems
Ignoring skewness can hide useful information and lead to incorrect conclusions about customers, sales, or business performance.
How to Handle Skewed Data?
Skewed data does not always need to be changed. However, some methods can make it easier to study and understand.
1. Log Transformation
Log transformation changes positive values to a smaller scale, reducing differences between large numbers and making positively skewed data easier to analyze.
2. Square Root Transformation
Square root transformation reduces differences between larger nonnegative values and can help make some uneven data distributions more balanced and easier to study.
3. Outlier Treatment
Analysts check unusually high or low values to identify possible errors and decide whether corrections are needed without removing genuine observations from data.
4. Use Median Instead of Mean
The median often gives a clearer picture of typical values when a few unusually high or low numbers strongly affect the overall average.
5. Choose Suitable Statistical Methods
Analysts choose statistical methods that work well with uneven data, helping them study patterns and obtain reliable results without changing the original distribution.
Difference Between Skewed Data and Normal Distribution
Skewed data and normal distribution describe different patterns in how values are spread.
| Basis | Skewed Data | Normal Distribution |
| Shape | Uneven | Symmetrical |
| Tail | Longer on one side | Balanced on both sides |
| Mean and Median | Often different | Equal |
| Extreme Values | May affect the shape | Values far from the center are less common |
| Examples | Income, property prices | Some measurement errors |
Applications of Skewed Data
Understanding it is useful in many industries. It helps people study information and make better decisions.
1. Financial Analysis
Financial analysts study salaries, investment returns, and transaction amounts to understand unusual patterns and possible financial risks.
2. Healthcare Research
Healthcare researchers examine patient waiting times, medical expenses, and test results to understand differences between patients.
3. Business Analytics
Businesses study customer spending, order values, and sales records to understand buying habits and improve decisions.
4. Machine Learning
Data scientists examine skewed numerical features and choose suitable methods to prepare data before training machine learning models.
5. Education
Schools and colleges study examination results to understand student performance and identify differences in learning outcomes.
Best Practices
Following a few simple practices can help analysts understand it and make better decisions.
1. Examine Data Distribution
Use charts and basic statistics to check how values are spread across the dataset and identify any unusual patterns before starting analysis.
2. Check Extreme Values
Identify unusually high or low values and understand why they appear before deciding whether any changes or corrections are needed in the dataset.
3. Choose Suitable Measurements
Use the median, percentiles, or other suitable measurements when extreme values affect the average and make it difficult to understand typical data.
4. Apply Transformations Carefully
Choose suitable methods to transform skewed data only when necessary, making sure the changes support the purpose of the analysis being performed.
5. Validate Analytical Results
Compare results before and after making changes to understand whether the selected methods improve data interpretation, accuracy, or overall machine learning performance.
Final Thoughts
Skewed data is common in daily life. It happens when values are not spread evenly. We can see it in salaries, house prices, exam marks, and shopping bills. Understanding skewed data helps us find patterns, avoid misleading averages, and choose the right methods to study information and make better decisions.
Frequently Asked Questions (FAQs)
Q1. Can skewed data occur in small datasets?
Answer: Yes, skewed data can appear in small datasets when a few values are much higher or lower than the remaining observations.
Q2. Is skewed data always a problem?
Answer: No, it is not always a problem. It may reflect natural differences and provide useful information about real situations.
Q3. Can a dataset have zero skewness without being normal?
Answer: Yes, a dataset can have zero skewness without following a normal distribution because symmetry does not always produce a bell-shaped pattern.
Q4. Can skewed data become normally distributed?
Answer: Some transformations can make skewed data more symmetrical, but they do not guarantee that the transformed values will follow a normal distribution.
Recommended Articles
We hope that this EDUCBA information on “Skewed Data” was beneficial to you. You can view EDUCBA’s recommended articles for more information –