Updated March 3, 2023
Introduction to Matlab fit
MATLAB fit method can be used to fit a curve or a surface to a data set. Fitting a curve to data is a common technique used in Artificial intelligence and Machine learning models to predict the values of various attributes.
For example, if we compare the weight of an item like rice with its price; ideally, it should increase linearly (Price will increase as the weight of rice will increase). If we fit a curve to this data of weight and price, we will get mostly a linear curve. Now someone looking at this linear curve can easily interpret the relation between the 2 attributes (weight and price in our example), without looking at the data.
Syntax:
- fitobject = fit (a, b, fitType) is used to fit a curve to the data represented by the attributes ‘a’ and ‘b’. The type of model or curve to be fit is given by the argument ‘fitType’
- Various values which the argument ‘fitType’ can take are given in the table below:
| Model Name | Description |
|
A polynomial curve with linear nature |
|
A polynomial surface with linear nature |
|
A polynomial curve with quadratic nature |
|
Linear piecewise interpolation |
|
Cubic piecewise interpolation |
|
A curve of the nature smoothing spline |
Table 1
Let us now understand how to fit a curve or a surface to data in MATLAB:
We will need some data to which we will fit the curve, for our examples, we will use some inbuilt data sets provided by MATLAB like ‘carsmall’ and ‘census’.
Examples of Matlab fit
Let us discuss examples of Matlab fit.
Example #1
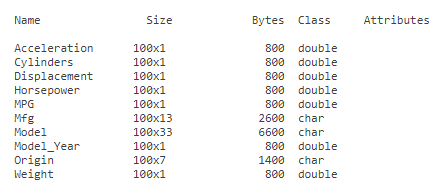
In this example, we will use the ‘carsmall’ data provided by MATLAB. The data is of various attributes of cars manufactured over the years 1970, 1976, and 1982. It has attributes like ‘Acceleration’, ‘Cylinders’, ‘Horsepower’ etc. which represent various features of a car. We will load this data to our workspace and will fit a curve to its attributes ‘Acceleration’ and ‘Displacement’. The steps to be followed for this example are:
- Load the ‘carsmall’ data to the workspace
- View the file loaded above to understand its attributes
- Use the ‘fit’ function to fit a curve to the loaded data
- Plot the model created in above step
Code:
1. load carsmall
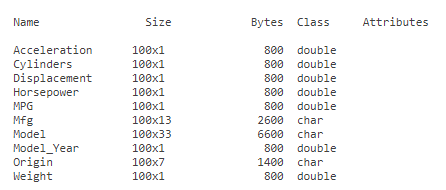
[Using the ‘load’ command to load the ‘carsmall’ data set to our workspace]2. whos -file carsmall
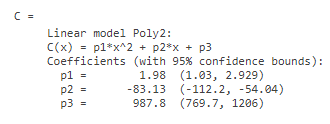
[Using ‘whos’ command to view the file loaded above]3. C = fit(Acceleration, Displacement, ‘poly2’)
[Using the ‘fit’ command to fit a curve to the data. The first 2 parameters represent the attributes to which we want to fit the curve and the 3rd parameter represents the type of curve which we want to fit (please refer to Table 1 for this)]4. plot(C, Acceleration, Displacement)
[Using ‘plot’ command to plot the model created in above step]This is how our input and output will look like in MATLAB command window:
Input 1:
Loading the carsmall data set:
![]()
Input 2:
Fitting the curve to the data:
![]()
Input 3:
Plotting the model created above:
![]()
Output 1:
Output 2:
Output 3:
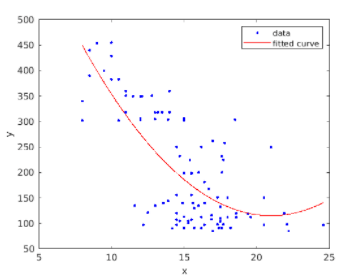
As we can see in Output 3, we have obtained a curve that fits our data. Output 1 and Output 2 represent the data attributes and the model respectively.
In the same example, we can also fit a different type of curve as per our requirement. Let us try to fit ‘smoothingspline’ curve to the above data.
The code will be similar as in the above example with a change in line 3
Code:
1. load carsmall
[Using the ‘load’ command to load the ‘carsmall’ file to our workspace]2. whos -file carsmall
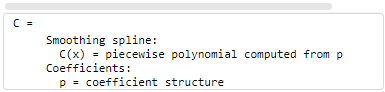
[Using ‘whos’ command to view the file loaded above]3. C = fit(Acceleration, Displacement, ‘smoothingspline’)
[Please note that the 3rd argument is now ‘smoothingspline’]4. plot(C, Acceleration, Displacement)
[Using ‘plot’ command to plot the model created in above step]This is how our input and output will look like in the Matlab command window:
Input 1:
Loading the carsmall data set:
![]()
Input 2:
Fitting the curve to the data:
![]()
Input 3:
Plotting the model created above:
![]()
Output 1:
Output 2:
Output 3:
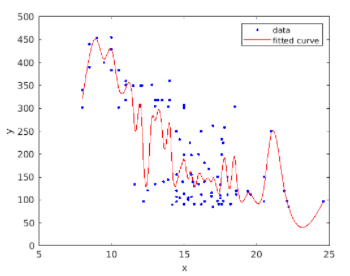
As we can see in Output 3, we have obtained a smoothing spline curve that fits our data.
Example #2
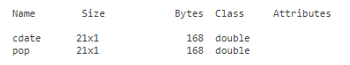
In this example, we will use the ‘census’ data provided by MATLAB. The data is of the US and gives the population of the country in a particular year. It has 2 attributes ‘cdate’ and ‘pop’ representing ‘census date’ and ‘population’. We will load this data to our workspace and will fit a curve to it. The steps to be followed for this example are:
- Load the census data to the workspace
- View the file loaded above to understand its attributes
- Use the ‘fit’ function to fit a curve to the loaded data
- Plot the model created in above step
Code:
load census
whos -file census
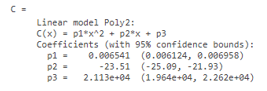
C = fit(cdate, pop, 'poly2')
plot(C, cdate, pop)
This is how our input and output will look like in MATLAB command window:
Input 1:
Loading the census data set:

Input 2:
Fitting the curve to the data:
![]()
Input 3:
Plotting the model created above:
![]()
Output 1:
Output 2:
Output 3:
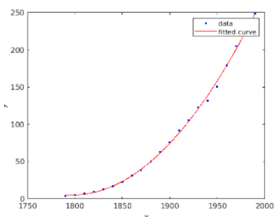
As we can see in Output 3, we have obtained a curve that fits our data. Output 1 and Output 2 represent the data attributes and the model respectively.
Conclusion
- We use ‘fit’ function in MATLAB to fit a curve to our data set
- Fitting a curve is very useful technique used in Machine learning
- We can control the type of curve that we want to fit to our data by using the ‘fitType’ argument.
Recommended Articles
This is a guide to Matlab fit. Here we also discuss the introduction, syntax, and different examples with code implementation. You may also have a look at the following articles to learn more –
