Updated August 24, 2023

Legends in Chart
In this article, we will learn about legends in chart. Before seeing how to add the legend and change the legend positions, we will first understand what legend is.
Legend
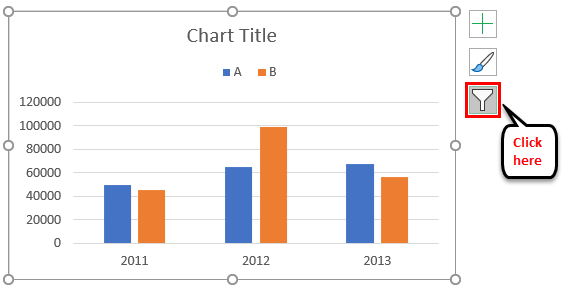
A Legend represents legend keys or entries on the plotted area of a chart or graph, which are linked to the data table of the chart or graph. By default, it may show on the bottom or right side of the chart. The data in a chart is organized with a combination of Series and Categories. Select the chart and choose the filter. Then, you will see the categories and series.
Each legend key will represent a different color to differentiate from the other legend keys.
Different Actions on Legends
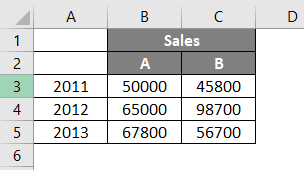
Now we will create a small chart and perform different actions on legends. Consider a small table that represents the sales of A and B for the years 2011, 2012, and 2013.
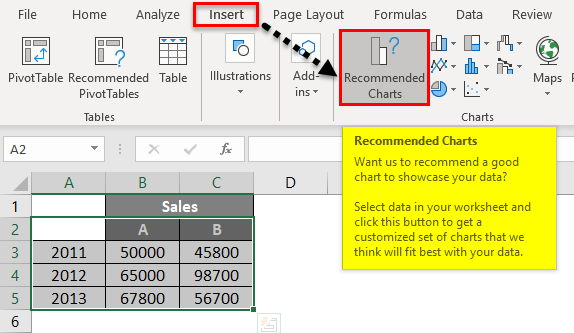
We will insert a chart by selecting the data and clicking the Insert menu button at the top. After that, select the Recommended Charts option.
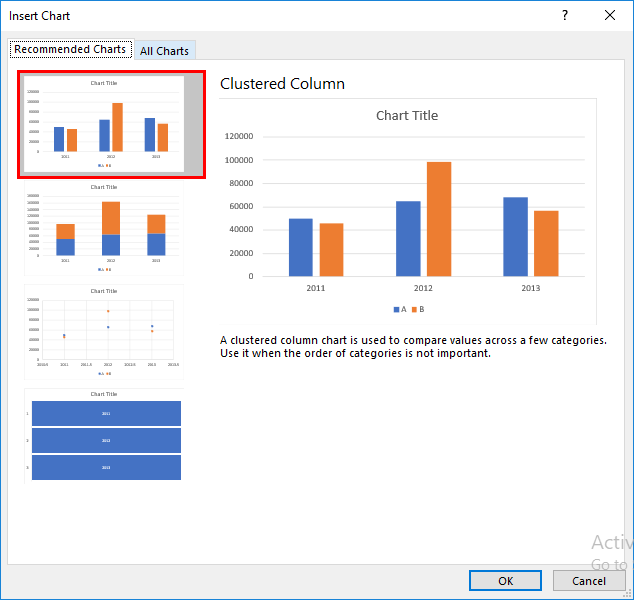
The below-suggested chart box will open. Choose any one chart from the available charts. Here we have selected the first chart.
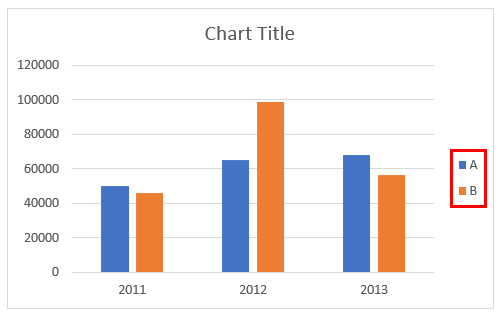
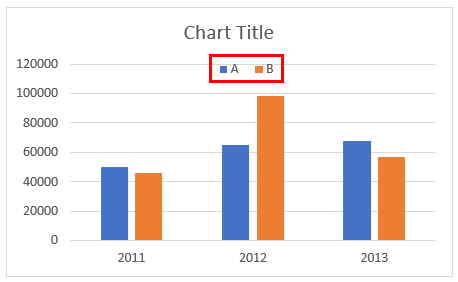
Then the chart will appear as below.
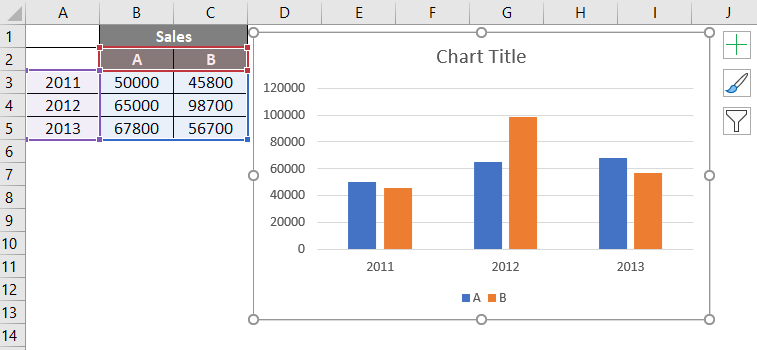
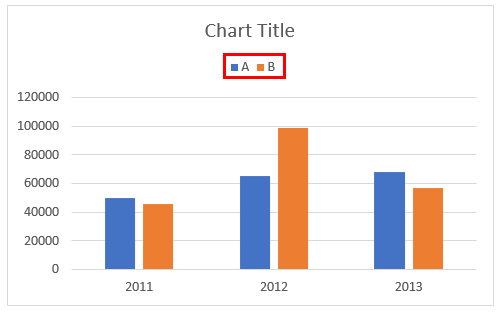
In the below chart, the keys A and B are highlighted with a red box called Legend.
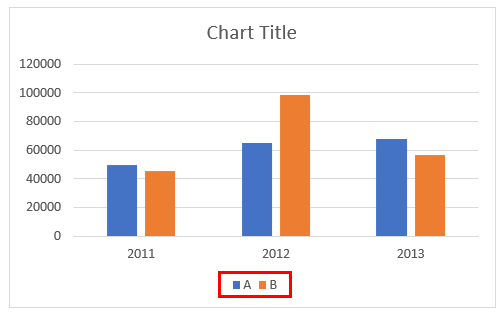
The Legend will be created automatically when we create a chart in Excel. If we observe, A and B represent two different colors, and the bars also represent the same color for 2011,2012, and 2013.
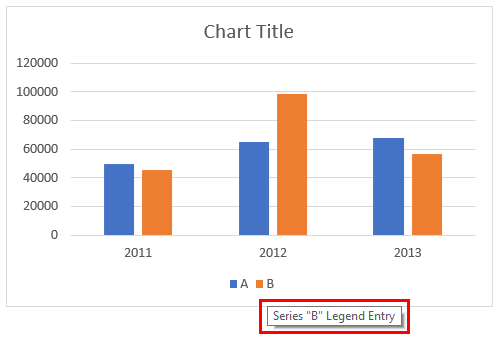
Here legend keys are vertical series of data. If we place the cursor on the legend keys, it will pop up the message.
How to Remove a Legend in Excel?
Suppose we want to remove the legend from the chart. Follow the below steps.
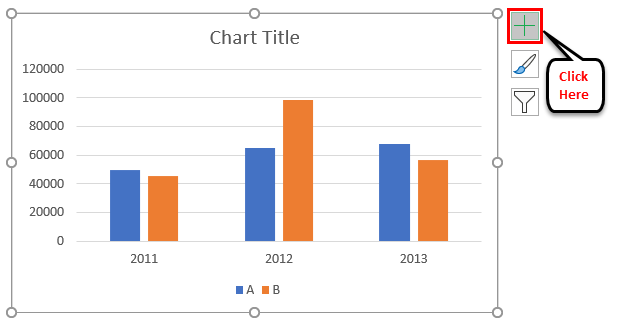
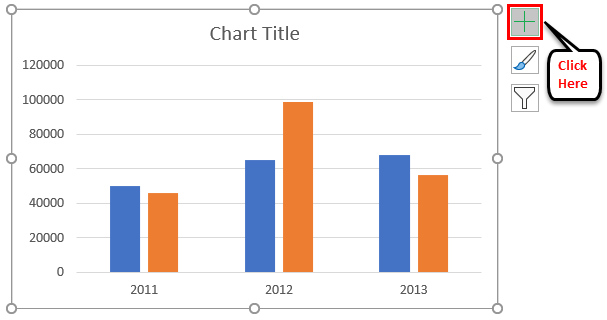
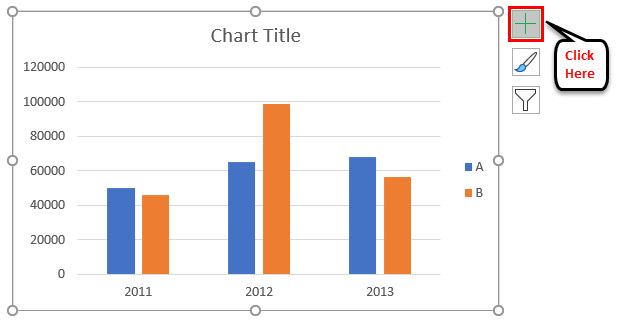
- Click on the chart so that it will be highlighted below. Click on the “+” symbol on the top right-hand side of the chart.
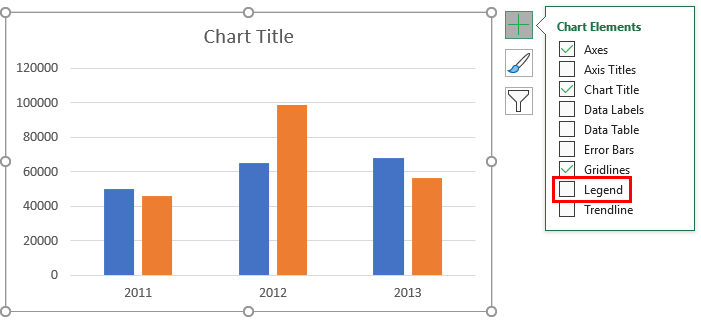
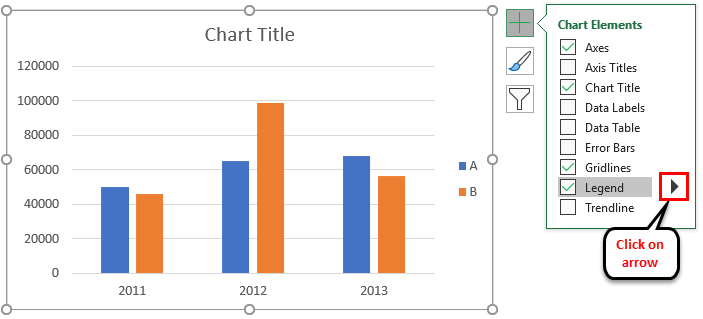
- It will give a popup menu with multiple options, as below. By default, Legend will be selected with a tick mark.
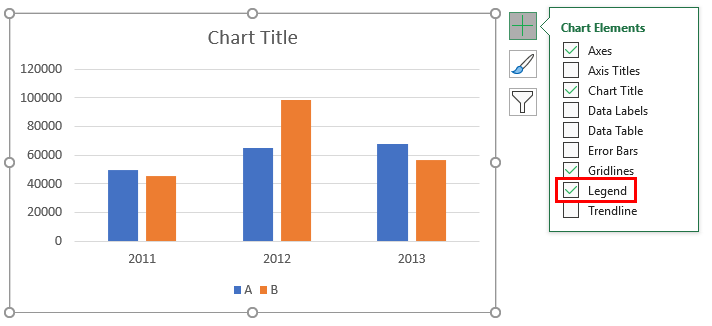
- If we want to remove the Legend, remove the tick mark for Legend.
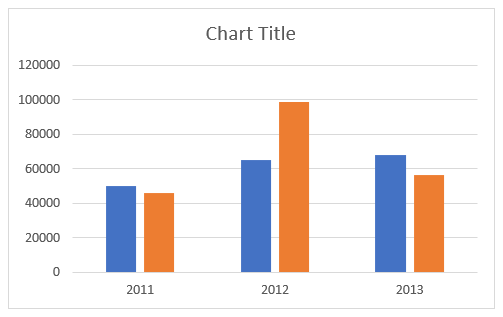
- We removed the tick mark; hence the Legend is removed from the chart we can observe in the below picture.
How to Add a Legend in Excel?
If we want to add the legend in the Excel chart, it is quite similar way how we remove the legend in the same way.
- Select the chart and click the “+” symbol at the top right corner.
- From the pop-up menu, give a tick mark to the Legend.
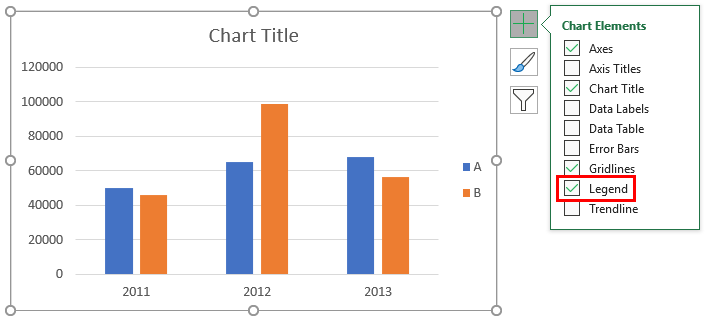
- Now Legend is available again.
- If we observe, the legend is now available on the right-hand side before it was at the bottom of the chart.
How to Change the Position of Legend in Chart?
Now we will see how to keep the Legend in the Excel chart at the required location.
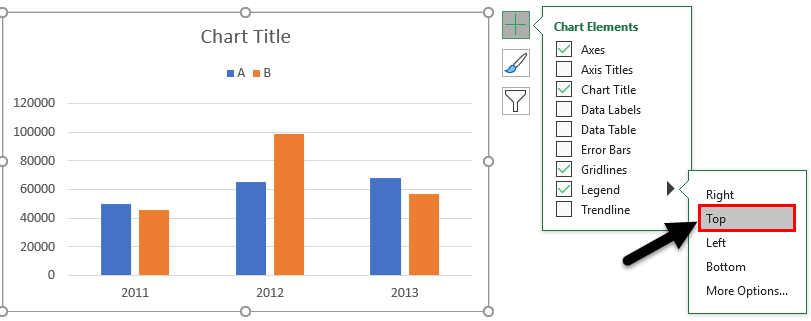
- Select the chart as usual. Click on the “+” symbol.
- From the pop-up menu, an arrow is directed towards the right when you choose legend if we observe. Click on the right arrow.
- A drop-down will appear.
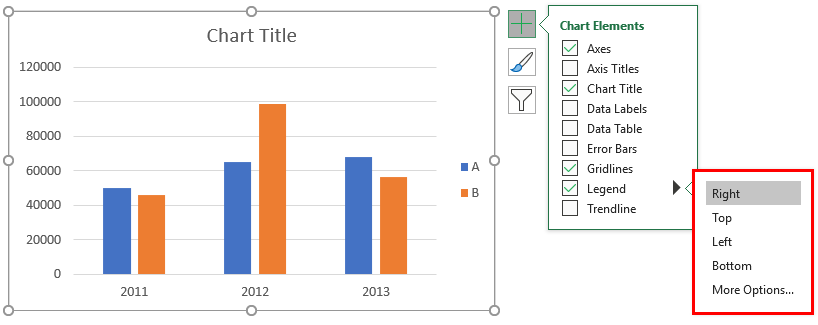
- As our Legend is now on the right side, the “Right” option is highlighted when we open it. Suppose we want to keep the legend on the Top. Select Top similarly as Right, Left, and Bottom. In this example, we will choose the Top option.
- Hence it moved to the top as below.
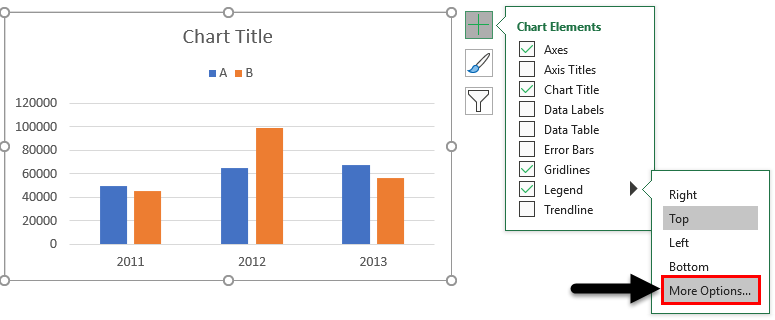
- Up to now, the Legend always appears separately from the chart. If we want to overlap the legend on the chart, click on More options available on the Legend.
- When we click on More options on the right side format menu for legend will appear. Show the legend without overlapping the chart option is available with a tick mark at the bottom of the Format legend.
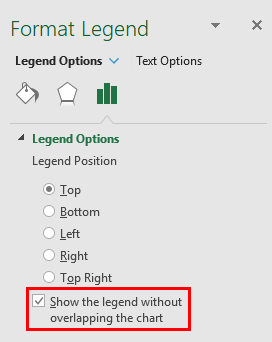
- If we want to remove the tick mark, click on it.
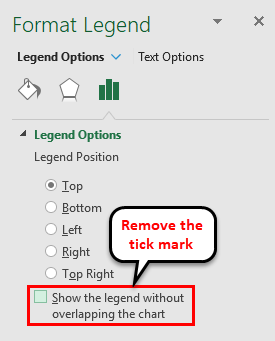
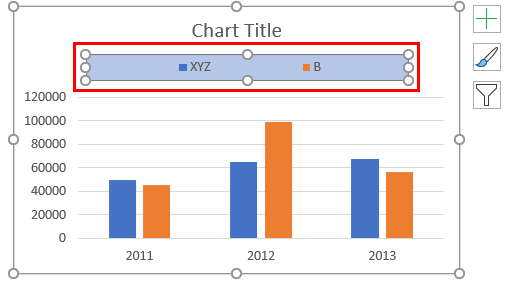
- Then the Legend will overlap with the chart as below image.
How to Edit the Legend Text in Chart?
In case we want to replace A with XYZ and B with ABC but without changing the data in the table, then, in that case, we can edit the Legend text.
- Select the chart and select the Filter on the right-hand side of the chart.
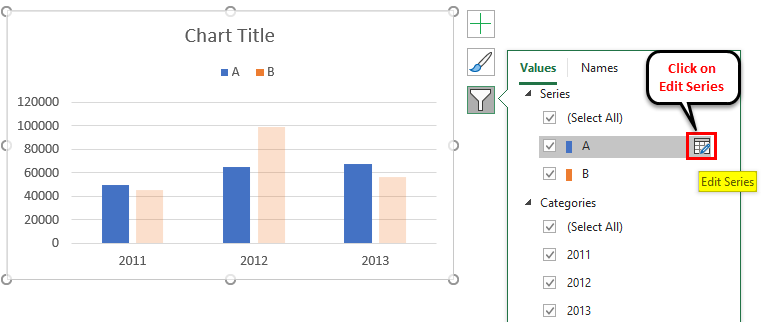
- If we want to edit the text of A to XYZ, then keep the cursor on A and choose the “Edit series” option while the mouse is pointing to A. Now click on Edit series.
- An Edit Series dialog box will appear below.
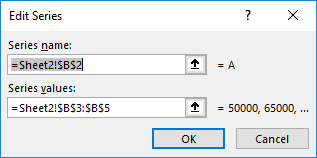
- It has a series name address and a series value address. If we want to change the series name to XYZ, change the name to XYZ and click OK.
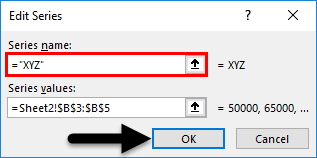
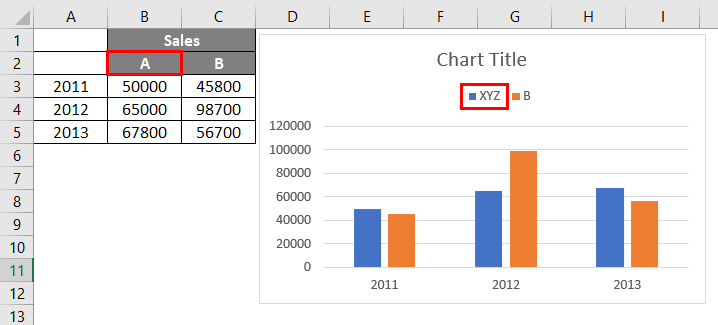
- The column name remains the same as A, but it is changed to XYZ on the chart.
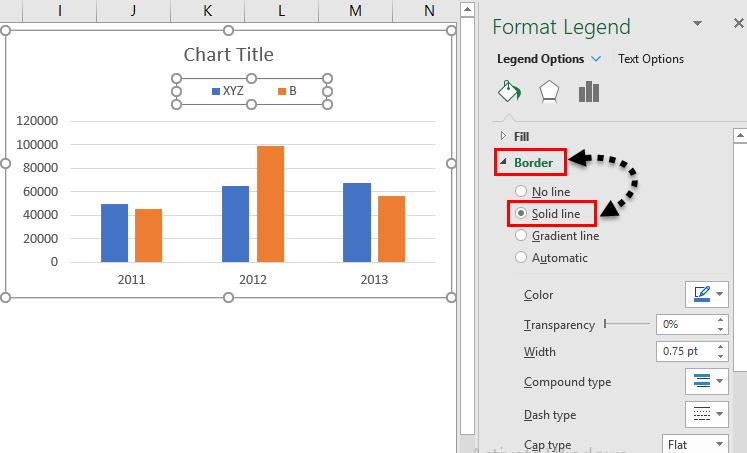
- If we want to give the border to the legend, we can give it by using “Format legend”. Under the border option, select the Solid Line, then it will create a border for the Legend.
- Suppose we want to give the background to the Legend. Click on the “Fill” drop-down and select the options Solid Fill.
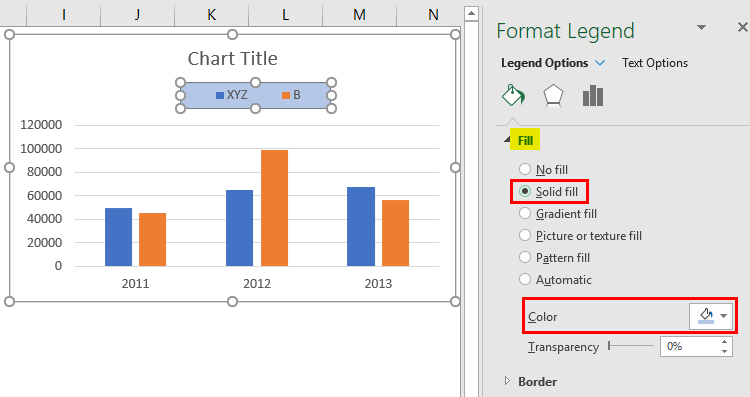
- We can give the required color by changing the color option marked in the above image. Instead of color, we can also select Gradient fill, Pattern fill, and picture.
- If we want to change the space occupied by the Legend, select the Legend and drag the legend using the mouse as per the required size.
Things to Remember About Legends in Excel Chart
- Legend is the space located on the plotted area of the chart in Excel.
- It has Legend keys that are connected to the data source.
- Legend will appear automatically when we insert a chart in Excel.
- We can move the Legend to the top, bottom, right, and left of the chart as per requirements by clicking on the “+” symbol, selecting the Legend option drop, and choosing a required option from the drop-down.
- Legend key names can be edited by clicking the filter option and changing the series name.
- If we want to remove the Legend from the chart, we can remove it by disabling the legend option from the “+” sign or selecting the Legend and clicking on delete.
Recommended Articles
This has been a guide to Legend in Chart. Here we discuss how to add, remove and change the position of legends in an Excel chart, along with practical examples and a downloadable Excel template. You can also go through our other suggested articles –
