What is Big Data?
Big data refers to large and complex datasets that exceed the capabilities of traditional data processing tools and methods for capture, storage, management, and analysis within a reasonable timeframe.
Traditional data processing cannot process data that is huge and complex. Thus we use big data to analyze, extract information, and understand the data better. We consider volume, velocity, variety, veracity, and value for big data. An example of big data is the data of people generated through social media. It helps to analyze the patterns in the data so that the behavior of people and businesses can be understood easily. This helps in efficient processing and hence customer satisfaction. It involves structured or unstructured data, which can be natural or processed and may be related to time.
Table of Contents
- What is Big Data?
- Examples
- Types
- Main Components
- Characteristics
- How Can things be made easier?
- Use Cases and Applications
- Top Companies
- Advantages and Disadvantages
- Pre-Requisites
- Challenges and Limitations
- Future Trends
Examples of Big Data
Here are a few examples:
- E-commerce Recommendations: Companies like Amazon and Netflix use it to recommend products and content to their users. They analyze user behavior, purchase history, and preferences to provide personalized recommendations, enhancing the user experience and driving sales.
- Healthcare Predictive Analytics: Hospitals and healthcare providers utilize it to predict disease outbreaks and patient outcomes. For instance, the analysis of patient data can help identify patterns that indicate a potential disease outbreak, allowing for timely interventions and resource allocation.
- Financial Fraud Detection: Banks and financial institutions use this analytics to detect fraudulent transactions. They can identify potentially fraudulent activities by analyzing real-time transaction data for unusual patterns.
- Social Media Sentiment Analysis: Social media platforms like Twitter and Facebook use it to analyze user posts and comments sentiment. This sentiment analysis helps companies and organizations understand public opinion and track brand perception.
- Smart Grid Management: Utilities employ it to manage and optimize energy distribution in smart grids. By analyzing data from sensors and meters, they can balance supply and demand more efficiently, reduce energy waste, and improve grid reliability.
- Agricultural Precision Farming: Farmers use it to optimize crop yields and resource utilization. They collect data from sensors, drones, and satellites to monitor soil conditions, weather, and crop health, enabling data-driven decisions about planting, irrigation, and harvesting.
- Transportation and Ride-Sharing: Companies like Uber and Lyft rely on big data for ride optimization. They analyze real-time traffic data, rider demand, and driver locations to match riders with the nearest available drivers and calculate dynamic pricing.
- Space Exploration: NASA and other space agencies use it to analyze vast data from satellites, rovers, and telescopes. This data helps scientists discover our solar system and the universe beyond.
- Weather Forecasting: Meteorologists use it to improve weather forecasting accuracy. By analyzing data from weather stations, satellites, and climate models, they can provide more reliable forecasts, which significantly impact agriculture, transportation, and disaster preparedness.
- Retail Inventory Management: Retailers optimize their inventory using this. They analyze sales data, historical trends, and supplier information to predict demand and ensure they have the right products in stock while minimizing excess inventory.
These examples illustrate how big data is applied across various industries to improve decision-making, enhance customer experiences, optimize processes, and drive innovation. Big data’s ability to analyze and derive insights from vast and diverse datasets transforms how organizations operate and deliver value.
Types of Big Data
This is typically categorized into three main types:
- Structured Data: This is highly organized and follows a defined format, such as relational databases or spreadsheets. Structured data, such as names, dates, and numerical values, can be easily analyzed and queried.
- Unstructured Data: Unstructured data lacks a predefined structure and includes text, images, audio, and video files. Analyzing unstructured data is more challenging but can yield valuable insights from sources like social media, emails, and multimedia content.
- Semi-Structured Data: This type has a partial structure, often in the form of tags or metadata. Examples include XML or JSON files. Semi-structured data strikes a balance between structured and unstructured data, making it versatile for various analytical purposes.
Main Components of Big Data
Given below are the main components as follows:
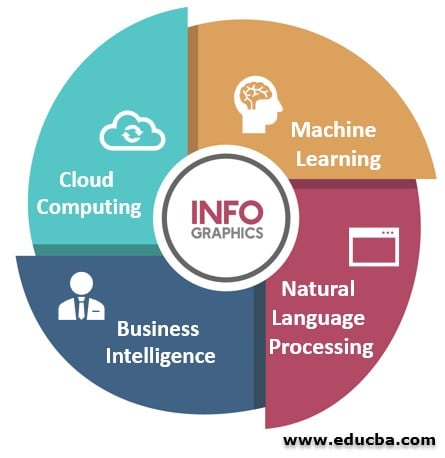
1. Machine Learning
It is the science of making computers learn stuff by themselves. Machine learning, algorithms, and statistical models expect a computer to perform specific tasks without explicit instructions. Machine learning applications provide results based on experience. For example, these days, some mobile applications will give you a summary of your finances, and bills will remind you of your bill payments and also may give you suggestions to go for some saving plans. These functions are done by reading your emails and text messages.
2. Natural Language Processing (NLP)
A computer can understand human language as spoken. The most apparent examples people can relate to these days are Google Home and Amazon Alexa. Both use NLP and other technologies to give us a virtual assistant experience. NLP is all around us without us even realizing it. When writing a mail, while making any mistakes, it automatically corrects itself. These days it gives auto-suggests for completing the mails and automatically intimidates us when we try to send an email without the attachment that we referenced in the text; this is part of Natural Language Processing Applications, which are running at the backend.
3. Business Intelligence
Business Intelligence (BI) is a method or process that is technology-driven to gain insights by analyzing data and presenting it in a way that the end-users (usually high-level executives), like managers and corporate leaders, can gain some actionable insights from it and make informed business decisions on it.
4. Cloud Computing
If we go by the name, it should be computing done on clouds; it is true, we are not talking about real clouds; the cloud here is a reference for the Internet. So we can define cloud computing as the delivery of computing services—servers, storage, databases, networking, software, analytics, intelligence, and more over the Internet (“the cloud”) to offer faster innovation, flexible resources, and economies of scale.
Characteristics of Big Data
Given below are the characteristics as follows:
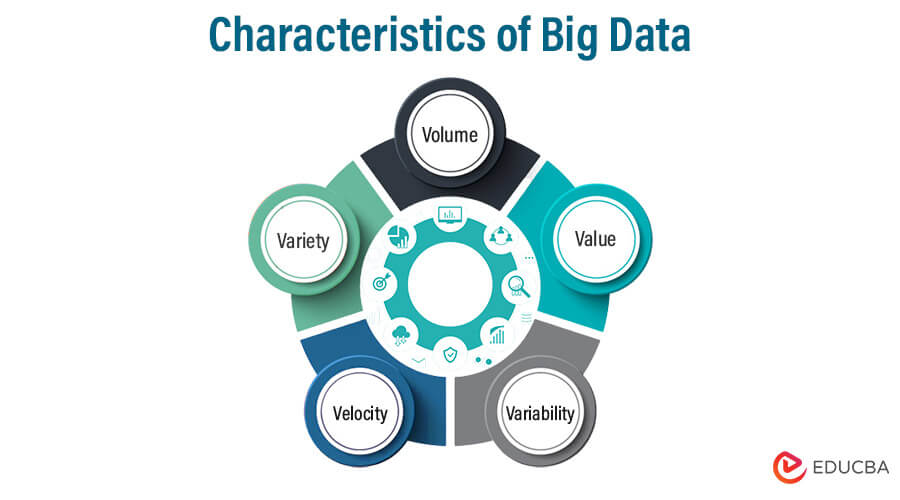
- Volume: To determine data value, the size must be considered, which plays a crucial part. Also, to identify if a particular type of data falls under the introduction category or not, it depends on volume.
- Variety: Variety means different data types according to their nature (structured and unstructured). Earlier, the only sources of data considered by most of the applications were in the form of rows and columns, which usually came in spreadsheets and databases. But nowadays, data comes in every form, like emails, photos, videos, audio, etc.
- Velocity: Velocity, as the name suggests, is the speed of data generation. From a source, how rapidly data can be generated and how fast it can be processed determines the potential of the data.
- Variability: Data can be variable, which means it can be inconsistent, not in the flow, that interferes or becomes a blockage in handling and managing data effectively.
- Value: Value is the ultimate goal of Big Data analysis. It refers to the ability to extract meaningful insights, make informed decisions, and create value for organizations.
How Can things be made easier?
In the past, individuals would analyze data by going through it line by line without the assistance of modern technology. However, with the emergence of computers, life became easier with Excel spreadsheets. Users could tabulate different records and perform the necessary analysis to produce meaningful reports. This development was a game-changer in many ways, as it allowed for the processing and analyzing extensive data sets, sometimes even in terabytes. Complex queries and algorithms could be applied, and reports generated with minimal errors. The speed of data processing varied, depending on the size of the data fed, but it could take minutes to hours. With third-party tools like Hadoop and Spark, large data sets can now be loaded onto external storage. The data is processed based on human queries, and business intelligence teams use these reports to understand predictive patterns and correct previous mistakes. Additionally, data can be visualized to make informed decisions.
Use Cases and Applications
It has numerous applications across various industries. Here are some key applications in brief:
- Business Intelligence (BI): Businesses can make informed decisions about customer behavior, market trends, and operational efficiency by analyzing large datasets.
- Healthcare Analytics: Improves patient care, disease detection, and drug development by analyzing medical records, genomic data, and sensor data.
- Financial Services: It’s used for fraud detection, risk assessment, algorithmic trading, and customer profiling to enhance financial operations and security.
- Retail and E-commerce: Helps retailers personalize recommendations, optimize supply chains, manage inventory, and forecast demand.
- Manufacturing: It’s used for predictive maintenance, quality control, and process optimization to reduce downtime and improve efficiency.
- Smart Cities: Aids in urban planning, traffic management, energy consumption optimization, and public services improvement for more sustainable and efficient cities.
- Marketing and Advertising: Marketers use data to target ads, measure campaign effectiveness, and understand consumer preferences for better marketing strategies.
- Social Media Analysis: It helps companies analyze social media data to understand customer sentiment, trends, and brand perception.
- Energy and Utilities: Monitors and optimizes energy grids, reduces energy waste, and improves resource allocation.
- Transportation and Logistics: It’s applied for route optimization, fleet management, and real-time tracking to enhance transportation efficiency.
- Agriculture: Helps farmers with precision agriculture by analyzing soil, weather, and crop data for optimal yield and resource use.
- Education: Educators use this tool to personalize learning, analyze student performance, and improve educational outcomes.
- Entertainment: It is employed in content recommendation systems for streaming platforms and analyzing viewer behavior to create engaging content.
- Human Resources: Companies use data to streamline recruitment, employee engagement, and talent management.
- Public Health: It is crucial for tracking disease outbreaks, monitoring public health trends, and improving healthcare delivery.
- Environmental Monitoring: It aids in tracking climate change, wildlife conservation, and environmental impact assessment.
Top Companies
Many top companies across various industries leverage Big Data to gain insights, enhance decision-making, and improve their operations. Here are some notable examples of companies:
- Amazon
- Netflix
- Walmart
- Tesla
- Uber
- Airbnb
- Ford
- NASA
Advantages and Disadvantages of Big Data
Given below are the advantages and disadvantages as follows:
| Advantages | Disadvantages |
| Data-Driven Insights: Enables data-driven decision-making, leading to improved strategies and outcomes. | Data Privacy: Raises concerns about the privacy and security of personal information. |
| Competitive Advantage: Provides a competitive edge by identifying market trends and opportunities ahead of competitors. | Data Overload: Managing and processing vast amounts of data can be overwhelming and resource-intensive. |
| Enhanced Customer Understanding: Allows for a better understanding of customer behavior, preferences, and needs. | Complexity: Handling diverse data types and sources requires specialized tools and expertise. |
| Improved Operational Efficiency: Optimizes processes, reduces costs, and enhances operational efficiency. | Quality Control: Poor data quality can lead to inaccurate analyses and decisions. |
| Innovation and Product Development: Facilitates innovation by uncovering new insights and ideas. | Infrastructure Costs: Building and maintaining the necessary infrastructure can be expensive. |
| Real-Time Decision-Making: Supports real-time analysis for immediate actions and responses. | Ethical Concerns: Raises ethical issues related to data collection, usage, and bias. |
Pre-Requisites
- Data Storage: Robust infrastructure and distributed storage systems like Hadoop Distributed File System (HDFS) to handle large volumes of data.
- Processing Frameworks: Tools like Apache Spark or MapReduce for efficient data processing and analysis.
- Data Sources: Access to diverse and high-volume data sources, including structured, semi-structured, and unstructured data.
- Scalable Hardware: Powerful servers and clusters to accommodate the data and processing demands.
- Data Integration:> Methods to consolidate and clean data from various sources for meaningful analysis.
- Analytics Tools: Utilize data analytics and machine learning tools for insights and predictions.
- Data Governance: Establish data governance practices to ensure data quality, security, and compliance.
Challenges and Limitations
- Data Privacy: Protecting sensitive data and complying with privacy regulations.
- Data Quality: Ensuring big data sources’ accuracy, consistency, and reliability.
- Scalability: Handling the growing volume, velocity, and variety of data.
- Costs: Managing expenses associated with storage, processing, and analysis.
- Complexity: Integrating diverse data sources and technologies.
- Skills Gap: There is a shortage of skilled professionals to work with big data.
- Security: Protecting against data breaches and cyber threats.
- Ethical Concerns: Addressing ethical issues related to data collection and use.
- Interoperability: Ensuring compatibility among various tools and platforms.
- Bias and Fairness: Mitigating biases in data and algorithms to ensure fairness.
Future Trends
Organizations will use this to gain strategic advantage.
- AI and ML Integration: Deeper artificial intelligence and machine learning integration to automate data analysis and decision-making.
- Edge Computing: Reducing latency and improving real-time analytics by processing data on IoT devices.
- Blockchain for Data Security: Implementing blockchain to enhance data security, privacy, and integrity.
- Quantum Computing: Leveraging quantum computing’s immense processing power for complex data analysis.
- Ethical AI: Focus on ethical AI to address biases, fairness, and responsible data use.
- Data Democratization: Making data accessible to non-technical users through self-service analytics tools.
- Graph Databases: Utilizing graph databases for complex data relationships and network analysis.
- Data Fabric: Building comprehensive data management ecosystems for seamless integration and governance.
- 5G Connectivity: Faster, more reliable 5G networks enabling rapid data transmission.
- Predictive Analytics: Advanced predictive modeling for proactive decision-making. These trends will shape the future of big data, driving innovation and transforming various industries.
Recommended Articles
We hope that this EDUCBA information on “Introduction to Big Data” was beneficial to you. You can view EDUCBA’s recommended articles for more information.

