What is VWAP?
VWAP, or Volume-Weighted Average Price, is a trading tool that shows the average price an asset has been bought or sold during the day. It also takes into account the volume of trade. This means it gives a more accurate picture of the real price levels by factoring in the price and the amount traded. Traders use VWAP to determine whether an asset trades at a fair price compared to the day’s average.
Traders commonly use the VWAP indicator in technical analysis to evaluate how an asset’s price changes during a trading session. Unlike other indicators that only focus on price movement, VWAP also factors in trading volume, making it especially useful for identifying key support and resistance levels and overall market trends.
How is VWAP Calculated?
To calculate Volume-Weighted Average Price:
- Multiply the asset price by the trading volume for each interval.
- Sum these results over a set period.
- Divide by the total trading volume during that period.
The result is plotted on a chart, forming the VWAP line, which can guide traders throughout the trading session.
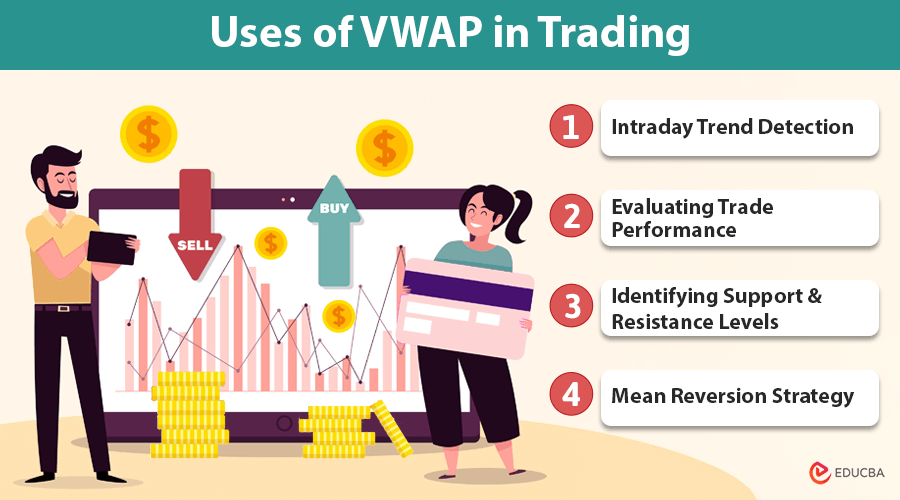
Uses of VWAP in Trading
Traders utilize the VWAP indicator in technical analysis for various purposes:
1. Intraday Trend Detection:
An asset’s price exceeding the VWAP may indicate an upward trend. Conversely, a price below the VWAP suggests a downward trend. Traders use this information to determine when to decide to buy or sell.
2. Evaluating Trade Performance:
Institutional traders often compare their average trade prices to the VWAP. Buying below the VWAP indicates a favorable price, as it is below the day’s weighted average.
3. Identifying Support and Resistance Levels:
The Volume-Weighted Average Price indicator can act as a key support or resistance area. When prices approach the VWAP, consolidation or rebounds often occur, making it an important reference point for traders.
4. Mean Reversion Strategy:
Some traders incorporate the VWAP indicator in mean reversion strategies, speculating that prices will return to the VWAP after significant deviations.
Limitations of VWAP
While the VWAP indicator is a powerful tool, it does have some limitations:
- Lagging Indicator: Since VWAP reflects past data, it does not respond quickly to sudden market changes, making it better suited for intraday trading than long-term predictions.
- Daily Reset: It resets at the start of each trading day, limiting its usefulness for multi-day or weekly analysis.
- Lack of Fundamental Data: It ignores volatility forecasts and fundamental analysis, so traders should pair it with other technical indicators for a more complete analysis.
Final Thoughts
The Volume-Weighted Average Price indicator is an essential part of any trader’s toolkit. Combining price and volume provides a more accurate picture of the market’s daily behavior. While it has limitations as a lagging indicator, its value in detecting intraday trends, evaluating trade performance, and identifying key support and resistance levels makes it a go-to tool for many traders.
When combined with other technical indicators, it can greatly enhance your trading decisions and help you keep up in rapidly changing markets.
Recommended Articles
We hope this guide on the VWAP indicator enhances your understanding of trading strategies and market analysis. Explore these recommended articles for more insights into effective trading tools and techniques.
