What Is the TRIX Indicator?
TRIX (Triple Exponential Average) is a technical analysis tool developed by Jack Hutson in the 1980s. It measures the rate of change of a triple-smoothed exponential moving average (EMA) of closing prices. By applying this triple smoothing, the TRIX filter effectively removes short-term market noise and highlights the underlying trend.
The TRIX indicator line oscillates around a zero baseline:
- A positive TRIX value indicates upward momentum.
- A negative TRIX value suggests downward momentum.
TRIX serves as both a trend-following indicator and a momentum oscillator, making it especially helpful in volatile markets with frequent whipsaws or false breakouts.
Table of Contents
- What Is the TRIX Indicator?
- How Is TRIX Calculated?
- Key Features of TRIX
- How to Use the TRIX Indicator in Trading?
- TRIX vs Other Technical Indicators
- Advanced TRIX-Based Trading Strategies
- Common Mistakes Traders Make with TRIX
- Backtesting TRIX Performance
- Real-World Applications of TRIX
- Limitations of the TRIX Indicator
- Enhancing TRIX Accuracy
- TRIX Indicator for Long-Term Investors
How Is TRIX Calculated?
The TRIX calculation involves the following steps:
- Calculate a 15-period Exponential Moving Average (EMA) of the closing price.
- Compute an EMA of that EMA (second smoothing).
- Compute a third EMA of the result (triple smoothing).
- Finally, calculate the 1-period percentage rate of change of the triple-smoothed EMA.
Formula:
TRIX = [(EMA3 – EMA3_previous) / EMA3_previous] × 100
Each level of smoothing reduces noise but also introduces more lag. The TRIX line shows momentum, and traders use a signal line—typically a 9-period EMA of the TRIX—to generate buy or sell crossovers.
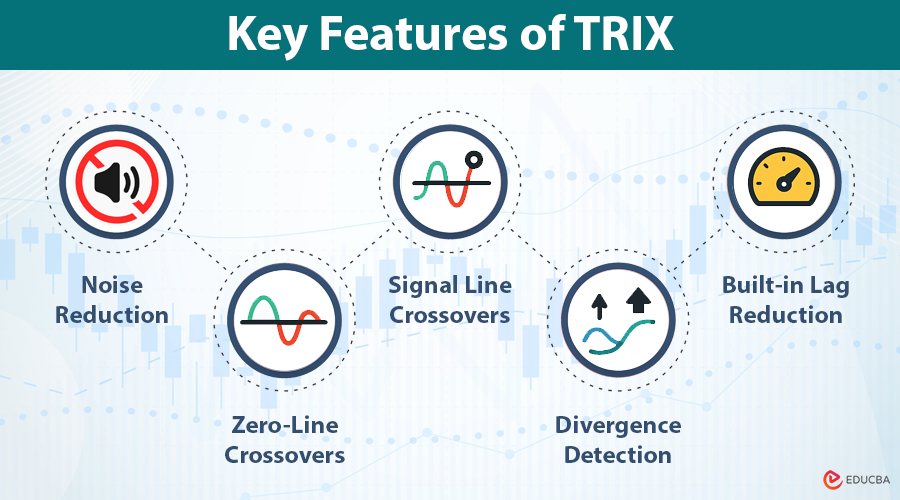
Key Features of TRIX
- Noise reduction: The triple EMA smoothing significantly dampens short-term price volatility.
- Zero-line crossovers: When TRIX crosses above the zero line, it signals upward momentum; below it indicates downward momentum.
- Signal line crossovers: Many traders use a 9-period EMA of TRIX as a signal line. A TRIX crossover above this line suggests a potential buy, and below indicates a possible sell.
- Divergence detection: Bullish or bearish divergence between price and TRIX can indicate upcoming trend reversals.
- Built-in lag reduction: While smoothing introduces lag, the percentage rate-of-change component helps mitigate it.
How to Use the TRIX Indicator in Trading?
Trend Identification
TRIX values above zero indicate that the trend is gaining upward momentum. Conversely, values below zero show weakening prices. The distance from the zero line can also indicate the strength of the trend.
Crossover Strategies
- Zero-line crossover: A move above zero suggests a bullish trend, while a drop below zero indicates bearish conditions.
- Signal line crossover: When the TRIX line crosses above its signal line, it can be an early indication to go long. When it crosses below, it may be time to exit or go short.
Divergence Strategies
- Bullish divergence: Price forms a lower low while TRIX forms a higher low. Indicates weakening selling pressure.
- Bearish divergence: The price forms a higher high, while the TRIX forms a lower high. Suggests weakening buying pressure.
TRIX vs Other Technical Indicators
TRIX vs MACD
While both measure momentum, MACD is based on the difference between two EMAs, while TRIX uses triple smoothing and rate-of-change. TRIX offers better noise reduction and is less sensitive to short-term fluctuations.
TRIX vs RSI/Stochastic
RSI and Stochastic Oscillators are bound between 0 and 100 and are more effective in range-bound conditions. TRIX, being unbounded, is more suited to trend-following.
TRIX vs DEMA/TEMA
Double and Triple Exponential Moving Averages (DEMA/TEMA) reduce lag more aggressively but lack the momentum component of TRIX.
Comparison Table:
| Indicator | Best Use | Sensitivity | Lag | Noise Reduction |
| TRIX | Trend following | Medium | Moderate | High |
| MACD | Momentum & crossover | High | Moderate | Medium |
| RSI | Overbought/Oversold | High | Low | Low |
Advanced TRIX-Based Trading Strategies
- TRIX + RSI Filter: Use RSI to confirm TRIX signals. For instance, take TRIX long signals only when RSI is above 50.
- TRIX + Bollinger Bands: When TRIX indicates a trend and price breaks out of the Bollinger Bands, it may confirm momentum.
- TRIX + Volume Spikes: Volume adds conviction. Pair TRIX buy signals with above-average volume for better entries.
Multiple Time Frame Analysis:
Use a higher time frame TRIX (e.g., daily) to determine the trend and a lower one (e.g., 15-min) for precise entries.
Uncommon Strategy:
Use TRIX divergence across correlated assets, such as the divergence in TRIX between the S&P 500 and NASDAQ, to anticipate rotation.
Common Mistakes Traders Make with TRIX
- Ignoring market context: TRIX performs best in trending markets; avoid relying on it during consolidation.
- No confirmation tool: You should support TRIX signals with volume, trendlines, or another indicator.
- Incorrect settings: Default settings may not work on all assets. Backtest custom values based on volatility and asset class.
Backtesting TRIX Performance
Backtesting helps quantify how well TRIX performs under different market conditions. Utilize tools such as TradingView Pine Script, Python’s Backtrader, or QuantConnect.
Example Backtest:
- Asset: BTC/USD
- Time Frame: 4-hour
- Entry: TRIX crosses above signal line
- Exit: TRIX crosses below signal line
- Result: 62% win rate, reduced drawdowns when combined with volume filter.
Test various combinations to optimize entries and exits. Include slippage and transaction costs for realism.
Real-World Applications of TRIX
- Stocks: Identify strong earnings momentum or breakout candidates.
- Forex: Detect shifts in currency strength or weakness.
- Crypto: Smooth out volatility in altcoins.
- Commodities: Confirm seasonal trends in metals or agriculture.
Platforms that support TRIX: MetaTrader 4/5, TradingView, Thinkorswim, Zerodha Kite, NinjaTrader.
Limitations of the TRIX Indicator
- Lagging nature: Like all moving averages, TRIX lags price, which may delay entries.
- Whipsaws in sideways markets: Give misleading signals when the price is range-bound.
- Requires additional confirmation: Works best in conjunction with support and resistance, candlestick patterns, or volume.
Enhancing TRIX Accuracy
- Adjust period lengths: Experiment with 7, 12, or 21 periods based on volatility.
- Adaptive TRIX: Modify settings dynamically using ATR or Bollinger Bandwidth.
- AI/ML integration: Use machine learning models to filter false TRIX signals or to predict TRIX turning points.
TRIX Indicator for Long-Term Investors
TRIX is not limited to active traders. Long-term investors can use it to:
- Time re-entries during market recoveries.
- Avoid prolonged downturns by exiting during strong bearish momentum.
- Confirm macro-level trends in ETFs and indexes.
Final Thoughts
TRIX stands out as a hybrid indicator that offers both momentum and trend clarity while minimizing false signals caused by price noise. It is especially valuable in:
- Trending markets
- Volatile assets like crypto
- Strategies that require both direction and timing
When used correctly and in combination with other tools, TRIX becomes a reliable component of any trading system.
Frequently Asked Questions (FAQs)
Q1. Can TRIX be used for intraday trading?
Answer: Yes. Use shorter periods (e.g., 9) and confirm with volume or price action.
Q2. What time frame works best with TRIX?
Answer: Daily for swing trades, 5-15 min for intraday. Weekly for long-term investing.
Q3. Should TRIX be used alone?
Answer: No. Always use it in conjunction with at least one confirmation tool, such as RSI, volume, or price patterns.
Q4. Is TRIX effective in all market types?
Answer: It is best in trending markets. Avoid it during low-volatility sideways phases.
Recommended Articles
We hope this in-depth guide to the TRIX Indicator helps you better understand its role in identifying momentum and trends. Explore these recommended articles for deeper insights into technical indicators, trading strategies, and market analysis tools.
