


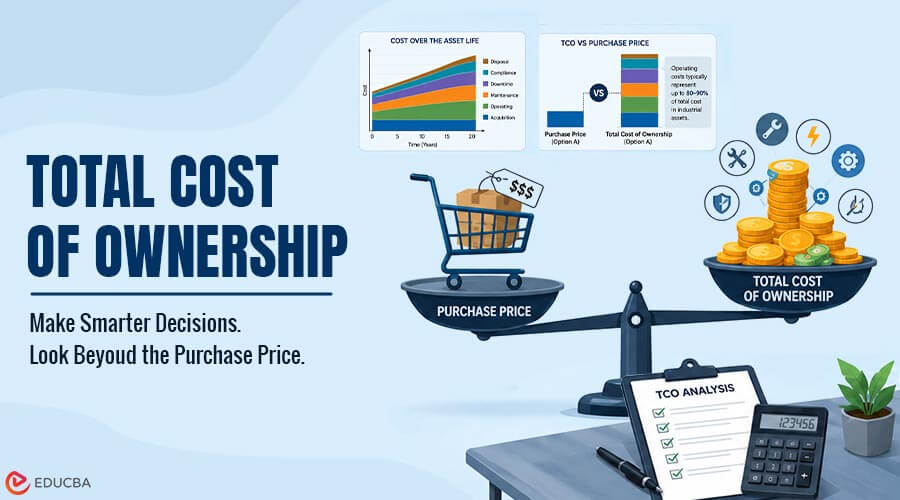
Total Cost of Ownership (TCO) is the sum of all costs an organization incurs over an asset’s entire life, from acquisition through operation, maintenance, and eventual disposal. It helps capital budgeting and procurement teams compare alternatives that differ in price but behave very differently once they enter service. The concept exists because purchase price poorly predicts what an asset actually costs. For some asset classes it is a reasonable proxy. For others, particularly energy-consuming industrial equipment, it is close to irrelevant, and choosing on price alone produces a decision that is wrong by a wide margin.
Why Purchase Price Misleads?
Purchase price has one property that makes it dominate decisions: it is visible, certain, and appears in the budget where everyone can see it. Operating costs are none of those things. They are spread across twenty years, sit in a different cost center, and are estimates rather than quoted figures.
The result is a systematic bias. Procurement teams optimize the metric they are measured on capital outlay, while someone else later bears the consequences in the operating budget. TCO corrects this by moving costs that would have been incurred anyway into the decision framework. It does not introduce new information.
Components of Total Cost of Ownership (TCO)
A TCO typically considers several categories of costs:
| Component | What it Includes |
| Acquisition | Purchase price, freight, duties, installation, commissioning |
| Operating | Energy, fuel, consumables, water, utilities |
| Maintenance | Scheduled servicing, spare parts, labour, consumable replacement |
| Downtime | Lost production during planned and unplanned outages |
| Compliance | Inspection, certification, emissions monitoring, reporting |
| Disposal | Decommissioning, removal, residual or scrap value |
Not every category matters equally. The analytical work in a TCO exercise is identifying which component dominates, because that is the one the decision should turn on. For IT hardware, the dominant component is often support and licensing. For vehicle fleets, it is fuel and maintenance, for industrial thermal equipment, fuel dominates, and the margin is not close.
The TCO Formula
In its simplest undiscounted form:
For capital budgeting, you cannot directly compare costs that occur in different years, so you discount recurring costs to their present value:
Where C₀ is the initial outlay, Oₜ and Mₜ are operating and maintenance costs in year t, r is the discount rate, n is the service life, Dₙ is disposal cost, and Rₙ is residual value. When the annual costs are approximately constant, the recurring term collapses into an annuity, which makes the arithmetic considerably simpler.
Worked Example: Comparing Two Industrial Boilers
Consider a plant selecting a steam boiler. Two units meet the same duty specification.
| Specification | Option A | Option B |
| Purchase Price | $80,000 | $110,000 |
| Thermal Efficiency | 88% | 95% |
| Annual Fuel Cost | $420,000 | $389,000 |
| Service Life | 20 years | 20 years |
The efficiency figures here are not assumptions. Published gas-fired steam boiler specifications put modern three-pass wet-back designs above 92% thermal efficiency, well clear of older or simpler configurations. That spread is what the comparison below turns on.
Option B costs $30,000 more to buy. Because it converts more of the fuel it burns into useful steam, it consumes about $31,000 less fuel every year.
Simple payback = $30,000 / $31,000 = 0.97 years
The additional capital is recovered in under twelve months. Discounted savings over the service life, at a discount rate of 8%: The 20-year annuity factor at 8% is 9.818.
PV of fuel savings = $31,000 × 9.818 = $304,358
NPV of choosing Option B = $304,358 − $30,000 = $274,358
Choosing the cheaper unit to save $30,000 destroys roughly $274,000 of value.
Why the Ratio Matters More Than The Method?
The arithmetic above is not sophisticated. Any analyst can run it. Yet people routinely make the wrong decision because nobody frames the question this way in the first place.
Look at the proportions in the example:
Over twenty years, Option B accumulates approximately $7.78 million in fuel cost against $110,000 of purchase price. Capital is roughly 1.4% of what the asset costs to own. Published guidance for industrial boilers commonly puts the fuel share of lifetime cost at around 90%, which is already enough to reverse most price-driven decisions. In continuously operated equipment at industrial scale, the real ratio is often considerably more extreme than that.
This gives a practical screening rule. Before comparing options, estimate what proportion of lifetime cost is operating cost. If the answer exceeds roughly 60%, purchase price should not be the deciding factor, and you should conduct a full TCO comparison. If the answer is below about 20%, price is a reasonable proxy and the additional analysis may not earn its cost.
Common Mistakes in TCO Analysis
A TCO model is only as reliable as the assumptions and costs it includes. Several common errors can result in inaccurate results.
- Omitting downtime: For assets in continuous production, an outage costs lost output, not just the repair. This is frequently the largest single omission in a TCO model.
- Using nominal rather than discounted figures: An undiscounted twenty-year cost stream overstates the value of distant savings. It usually still favors the efficient option, but the magnitude is wrong.
- Treating efficiency as static: Equipment degrades. A unit that starts at 95% will not stay there without maintenance, and the maintenance assumption belongs in the model explicitly rather than as an implicit hope.
- Ignoring load profile: Efficiency ratings are quoted at rated output. Equipment that spends most of its life at 30% load does not deliver rated efficiency, which is why oversizing is expensive in a way that never appears on the quotation.
- Comparing different service lives without annualizing: You cannot compare two options with 15-year and 25-year lives on total cost. Convert to equivalent annual cost first.
Final Thoughts
Total Cost of Ownership is not a difficult technique. It is a discipline of scope: deciding which costs to count when the decision is still open, even if those costs were always going to be incurred. Its value is highest wherever operating cost dominates capital cost, which describes most energy-consuming industrial assets and much of IT and fleet procurement as well. In those categories, the purchase price is not merely an incomplete signal. It frequently points in the opposite direction from the correct answer. The screening question is worth asking on every capital decision, and it takes about a minute: over the life of this asset, what fraction of the total will the purchase price actually represent?
Recommended Articles
We hope this comprehensive guide to Total Cost of Ownership helps you make smarter purchasing and investment decisions. Check out these recommended articles for more insights into financial analysis and cost management.