Updated March 15, 2023

Introduction to TensorFlow Profiler
The TensorFlow Profiler (also known as the Profiler) is a suite of tools for measuring the development of effective resource consumption of TensorFlow models. This latest version of the Profiler is built on top of current features like the Trace Viewer and is incorporated into Tensor Board. As a result, the TensorFlow Profiler makes it much easier to identify the bottleneck in the training process to focus our optimization efforts there.
Overviews of TensorFlow Profiler
TensorFlow’s profiling module, TFProfile, is available. This module makes it simple to record the time for each operation. A Tensor board is preferred for visualization. Profiling aids in understanding the hardware resource consumption (time and memory) of the various TensorFlow operations (ops) in the model, as well as the resolution of performance bottlenecks and, ultimately, the faster execution of the model.
TensorFlow profiler Setup
Installing Profiler Plug-in

pip install -U tensorboard_plugin_profile

The latest versions of TensorFlow

import TensorFlow as tf

print("TensorFlow version: ", tf.__version__)
How to Profile a Model
The model used in TFProfile- taking a timestamp
def buildmodel (lr = 0.03):

mdl1 = Sequential ()

mdl1.add (Convolution2D (32, 3, 3, border_mode='same',kernel_regularizer=regularizers.l2(0.0001), input_shape=(32, 32, 3)))

mdl1.add(Activation('relu'))

mdl1.add(BatchNormalization ())

mdl1.add(Convolution2D(64, 3, 3,kernel_regularizer=regularizers.l2(0.0003),border_mode='same'))

mdl1.add(Activation('relu'))

mdl1.add (BatchNormalization ())

mdl1.add(MaxPooling2D(pool_size=(1, 1)))

mdl1.add(Dropout(0.2))

mdl1.add(Convolution2D(32, 1, 1))

mdl1.add(Convolution2D(64, 3, 3,kernel_regularizer=regularizers.l2(0.0001),border_mode='same'))

mdl1.add(Activation('relu'))

mdl1.add(BatchNormalization())

mdl1.add(Convolution2D(128, 3, 3,kernel_regularizer=regularizers.l2(0.0001),border_mode='same'))

mdl1.add(Activation('relu'))

mdl1.add(BatchNormalization())

mdl1.add(MaxPooling2D(pool_size=(2, 2)))

mdl1.add(Dropout(0.3))

mdl1.add(Convolution2D(32, 1, 1))

mdl1.add(Convolution2D(128, 3, 3,kernel_regularizer=regularizers.l2(0.0001), border_mode='same'))

mdl1.add(Activation('relu'))

mdl1.add(BatchNormalization())

mdl1.add(Convolution2D(256, 3, 3,kernel_regularizer=regularizers.l2(0.0001), border_mode='same'))

mdl1.add(Activation('relu'))

mdl1.add(BatchNormalization())

mdl1.add(MaxPooling2D(pool_size=(2, 2)))

mdl1.add(Dropout(0.5))

mdl1.add(Convolution2D(11, 2, 1))

mdl1.add(AveragePooling2D(pool_size = (4,4)))

mdl1.add(Flatten ())

mdl1.add(Activation('softmax'))

sgd = optimizers.SGD(lr=lr, momentum=0.8, decay=1e-6, nesterov=True)

print("lr:- \n",lr)

mdl1.compile(optimizer=sgd, loss='categorical_crossentropy', metrics=['accuracy'])

mdl1.summary()

return mdl1
So, we’ll use the MNIST dataset for this demonstration and perform some user data pre-processing, such as data normalization and shuffling.
Now, load and pre-process the Dataset:
(d_train, d_test), ds\_info = tfds. load(

'mnist',

split=['train', 'test'],

shuffle_files=True, as_supervised=True,with_info=True,)

def rescale(image, label):

return tf.cast(image, tf.float32) / 255., label

d_train = d_train.map(rescale)

d_train = d_train.batch(128)
The model will be a very simple Sequential model with three layers.
Create a model:
def GetModel():model=tf.keras.models.Sequential([ tf.keras.layers.Flatten(input_shape=(26,26,1)), tf.keras.layers.Dense(126,activation='relu'), tf.keras.layers.Dense(10,activation='softmax')])return model
Training a Model
model.fit(

d_train,

epochs=2,

validation_data=d_test,

callbacks = [tensorboard_callback]
Using the Profiler
Profiler is a model performance simulator for Machine Learning (ML) model scripts. A profiler can be utilized in the training and inference stages of the development process. It’s especially useful for assessing script performance and resource needs for simulations and scripts delivered to edge devices. For example, with Profiler, one could see how much Memory space your model script uses on the target device and how long it takes to run.
After Modeling, next use profiling
#Import the heavenly Body

import tensorflow as tf

log_dir="logs/profile/" + datetime.now().strftime("%Y%m%d-%H%M%S")

tensorboard_callback = tf. keras.callbacks.TensorBoard(log_dir=log_dir, profile_batch=3)

callbacks_list=[tensorboard_callback]
mod_info = mdl2.fit_generator(train_iterator,

steps_per_epoch=len(train_iterator),

validation_data=(test_features,test_labels),

epochs=1, verbose=1,callbacks=callbacks_list)
We’ve used two options in this case: log dir and profile batch. The location of the logging directory is provided by log dir, and the profile batch is used to decide which batch to profile. Define hyperparameters such as the number of epochs, batch size, and data enhancement. For example, we can raise batch size to improve system utilization, which may cause CPU bottlenecking. On the other hand, data pre-treatment with augmentation on a big batch size necessitates a lot of computation.
In the following part, our users will learn how to use the TensorFlow Profiler to track the execution of their TensorFlow code.
Sample code
model = keras.Sequential([

layers.Dense(512, activation="relu"),

layers.Dense(10, activation="softmax")

])

model.compile(optimizer="rmsprop",

loss="sparse_categorical_crossentropy",

metrics=["accuracy"])

train_images = train_images.reshape((60000, 28 * 28))

train_images = train_images.astype("float32") / 255

test_images = test_images.reshape((10000, 28 * 28))

test_images = test_images.astype("float32") / 255
TensorFlow Profile model performance
Four methods of gathering performance data are described in Profile Performance. One of them is unique to the Keras user interface. The other (sample selection mode) is interactive via the Tensor board web interface.
Model training
tf.profiler.experimental.start('logdir')

tf.profiler.experimental.stop()

with tf.profiler.experimental.Profile('logdir'):

// model code

pass
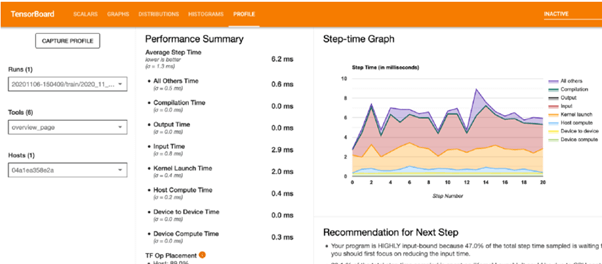
The following is a high-level summary of the model’s performance:
The Step-time Graph shows the number of steps (x-axis) vs. the time it takes to complete each step (step-time, y-axis). It also indicates each category’s step-time (the colored partitions). We can see from the graph above that our model is ‘HIGHLY input bound,’ meaning it spends a significant portion of its training time on input operations. We’ll work on improving this over time:)
The device’s Op placement should be as high as possible to get the most out of the GPU.
The average step time is broken down in the Average Step Time (under Performance Summary). In an ideal world, we’d like our model to spend the majority of its time ‘training,’ that is, keeping the GPU busy (Device Compute Time must be the highest, and all the other overheads must be as low as possible).
TF Op, The percent of operations conducted on the host (CPU) vs. the device, is shown in TF Op Placement (under Performance Summary) (GPU). The device Op positioning must be maximized to enhance GPU utilization.
Caching and prefetching are used to help us optimize.
- Data.dataset.cache: The Dataset will be loaded into memory or local storage using Dataset.Cache. On every epoch, this would save time by avoiding time-consuming I/O operations such as opening and reading data from files.
- Data.Dataset.Prefetch: The data will be prepared in advance and in parallel.
Profiler Instrumentation
programmatic mode
– TensorBoard keras callback
– tensor Flow profiler APIs and sampling mode (enables on-demand profiling).
Example using tf.profile()
import * as tf from "@tensorflow/tfjs"

let eduprof =

await tf.profile(function (){

let cba1 = tf.tensor4d([[[[7], [11]], [[13], [34]]]]);

return cba1;

});

console.log("newBytes ")

console.log(eduprof.newBytes);
Output:
Conclusion
This article demonstrates that Tensorflow Profiler is a powerful and simple-to-use tool (after you get beyond the installation barriers) that can save you a lot of time and a portion of the Profiler’s capabilities. First, we discussed a really handy TensorFlow tool for debugging a model. Then, we looked at what the tool has to prefer, how to utilize it, and how to improve the performance of a TensorFlow model on GPU. After that, there’s much more to the profiler and optimization techniques, which we’ll discuss in more detail in the next section.
Recommended Articles
This is a guide to tensorflow Profiler. Here we discuss what the tool has to prefers, how to utilize it, and how to improve the performance of a TensorFlow model on GPU. You may also have a look at the following articles to learn more –
