Heatmap Investing: Turning Market Color Codes into Profitable Insights
In the fast-paced markets, investors are constantly seeking tools that enable them to make quicker, more informed decisions. One such visual aid that has gained popularity is the stock heatmap—a real-time color-coded view of stock performance across sectors and industries. It is a powerful snapshot that instantly shows where the action is happening.
However, here is the catch: while a green block might signal an opportunity and a red block might trigger caution, a heatmap is not the full picture. It is a tool, not a crystal ball. Used wisely, though, it can help investors navigate market trends and position their portfolios more effectively.
What Is a Stock Heatmap?
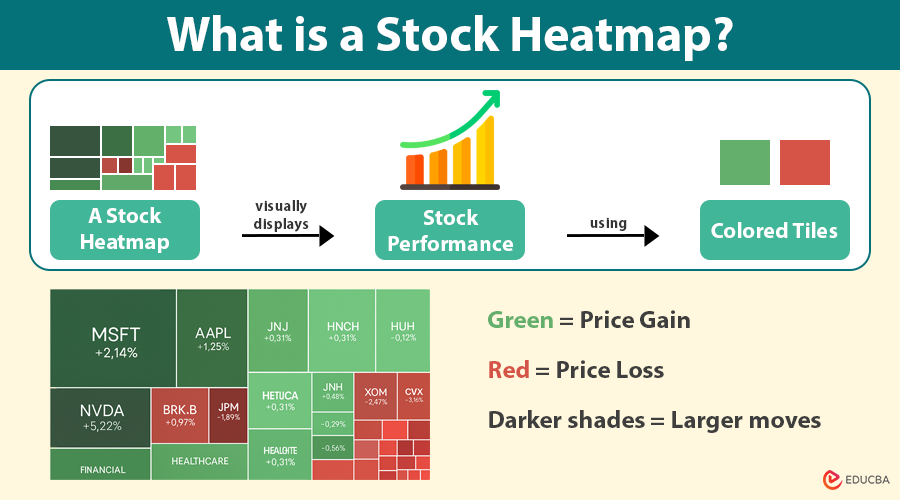
A stock heatmap visually displays stock performance using colored tiles. Each tile represents a stock, and its color shows its performance:
- Green indicates a price gain.
- Red indicates a price loss.
- Darker shades = Larger moves.
The size of each tile often represents the market capitalization of the company—larger tiles = bigger companies. These tiles are grouped by sectors such as Technology, Energy, Healthcare, and Finance, allowing investors to see which areas of the market are heating up or cooling off at a glance.
What do the Colors Mean?
The beauty of a heatmap lies in its simplicity. When the tech sector flashes green across the board, it usually means investors are piling into those stocks. This “green cluster” might signal an ongoing rally or a breakout in the sector.
On the other hand, when an entire sector turns red, it may indicate broad-based weakness—perhaps triggered by disappointing earnings, policy changes, or global uncertainty. This red warning is not necessarily a sign to sell everything, but a cue to dig deeper.
In short:
- Green = Go: Momentum, strength, or bullish sentiment.
- Red = Caution: Weakness, sell-offs, or negative sentiment.
Why is Stock Heatmap Only the Starting Point?
It is tempting to make decisions based solely on a heatmap’s color cues, but that would be a mistake. Here is why:
- No context: A green tile does not tell you why the stock is up. It could be due to speculation, a short squeeze, or a one-time news event.
- No fundamentals: Heatmaps do not show valuation, earnings, debt, or cash flow.
- No technical indicators: You will not see moving averages, RSI, or support and resistance levels on a heatmap.
- Short-term bias: Heatmaps usually reflect intraday or daily performance. Long-term trends may tell a different story.
So, while the heatmap is a great tool for identifying patterns and getting quick overviews, savvy investors use it in conjunction with more in-depth analysis.
How to Use a Stock Heatmap Effectively?
To turn stock heatmap signals into real investing insights, consider these steps:
1. Scan for Sector Strength
If the majority of a sector is green, it is likely experiencing bullish momentum. This can help you spot where money is flowing.
2. Drill Down to Individual Stocks
Click into a sector to explore which specific stocks are driving the movement. Is it just one big player, or is the rally broad-based?
3. Cross-Reference with News and Fundamentals
Use platforms like Yahoo Finance, MarketWatch, or your brokerage to check earnings reports, analyst ratings, and financial statements, including balance sheets.
4. Pair with Technical Analysis
Once you have spotted a promising stock on the heatmap, check its chart. Look for confirmation through trends, volume, and indicators.
Real-World Example
Let us say you open the stock heatmap and notice the Energy sector flashing green. Almost every tile—ExxonMobil, Chevron, Halliburton—is gaining.
This could indicate:
- Rising oil prices
- A geopolitical disruption
- Strong earnings from energy companies
Before jumping in, you should:
- Confirm what is driving the move
- Look at the charts for entry points
- Evaluate if the trend has legs or is already overbought
Final Thoughts
Heatmaps are like the weather radar of the stock market: they give you a high-level view of what is happening now, where storms are brewing, and where the sun is shining. However, they do not tell you how to build a house—you will need plans, materials, and a strategy.
So, yes, green means go, and red means caution, but do not drive without caution. Combine the heatmap with research, technicals, and fundamentals. Use it as your starting point—and not your final destination—for making profitable investment decisions.
Recommended Articles
We hope this guide on stock heatmaps helps you decode market movements and make smarter investment decisions. Explore these recommended articles for deeper insights into technical analysis, sector trends, and real-time trading tools.
