Mean, Median, and Mode in Data Analysis
If you use them in your work, you know that measures of central tendency, such as the mean, median, and mode, come into play. However, for most people, the average is the only tool they ever use. Understanding Mean, Median, and Mode in Data Analysis is crucial for making accurate decisions.
Relying on a single metric is a dangerous game in any professional field. It’s the difference between a high-level analyst who actually understands the business and a casual observer who is just reading a headline. If you want to draw insights that actually matter, you have to know which tool to grab for which job.
The Mean
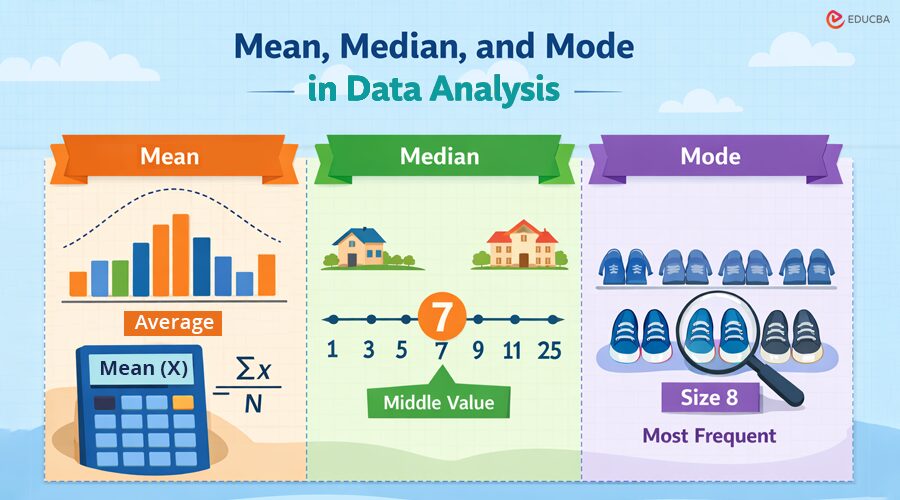
The mean is basically what most people mean when they say ‘average’. You take every single number in your set, pile them together into one big total, and then divide that by however many points you have. It is the most democratic way to find the center of your data because every single piece of information gets an equal vote in the final result.
This approach works perfectly when your data follows a clean, predictable pattern. Think about human height or the weight of a standard product coming off an assembly line. Most of the numbers in your set huddle right around the center. You might have a couple of extreme cases on the far ends, but they are the exception. In a real office, if your dev team is logging how many minutes it takes to kill off small bugs, the mean gives you a solid, predictable baseline for what a typical Tuesday looks like. It is a practical, no-nonsense tool for mapping out your week.
The Median
When your data is messy or skewed, the median is your best friend. It is the literal middle point. The median is the middle value when all numbers are arranged in ascending order.
This is why we use the median for home prices and salaries. If you live in a neighborhood with nine $300k homes and one $10 million mansion, the mean home price would suggest the typical house is worth over a million dollars. That is a total lie. The median, however, stays at $300k, accurately reflecting reality for 90% of the residents.
In the business world, the median helps you find the “typical” experience. It filters out the noise of one-off lucky breaks or total disasters, showing you where the bulk of your data actually lives. Using Mean, Median, and Mode together in data analysis helps analysts avoid these common pitfalls.
The Mode
The mode is the value that shows up most often. It is unique because it works with non-numeric data, such as colors or categories. In retail, the mode is king. A shop owner does not care about the average shoe size sold (which might be an 8.4); they need to know the mode of the size customers actually walk in and ask for so they can keep it in stock.
| Mean | Best Used For | Real-World Example |
| Mean | Consistent, predictable sets | Daily electricity usage in an office |
| Median | Sets with extreme “highs” or “lows” | Tech startup founder salaries |
| Mode | Identifying the most popular choice | Most frequent “Reason for Return” in e-commerce |
A Case Study in Skewed Data: E-commerce Shipping
Let us look at a real-world scenario. A mid-sized e-commerce company wants to advertise its “Average Delivery Time.”
- 95% of their orders arrive in 48 hours.
- 5% of their orders (due to a specific international warehouse issue) take 30 days to arrive.
If they use the Mean, their “average” delivery time looks like 3.4 days. They appear slower to 95% of their customers and promise faster delivery than they can achieve for the 5% of orders that are delayed. By switching to the Median, they can accurately advertise a 2-day delivery window for the “typical” customer while using the Mode to identify which specific warehouse is causing the 30-day outliers.
Choosing Your Tool
Choosing your tool depends entirely on the story you are trying to tell. If you are moving fast and want to see how an outlier is warping your results, a quick mean, median, and mode calculator can be a total lifesaver. It is a great way to visualize how adding one massive number pulls the mean miles away while the median stays perfectly still. Ultimately, mastering central tendency is not really about the math; it is about understanding the actual shape of your reality. The mean is about the whole group, the median is about the middle, and the mode is about the crowd. Use them together, and you will never get fooled by a single number again.
Effective data analysis is about picking the right measure for the right moment. While the mean is common, it is easily skewed by outliers. The median gives you a more representative “typical” value in messy datasets, and the mode identifies the most frequent value. Combining these metrics with a small amount of smart Excel navigation yields far more accurate and actionable business insights.
Final Thoughts
- The Mean: Best for stable, symmetrical data where every point should have an equal vote.
- The Median: The literal middle point, essential for skewed data like salaries or home prices.
- The Mode: Identifies the most frequent outcome, vital for inventory and trend analysis.
Using the wrong metric can lead to expensive business errors by hiding the “typical” experience. Mastering Mean, Median, and Mode in Data Analysis ensures your insights are both accurate and actionable.
Recommended Articles
We hope this guide on Mean, Median, and Mode in Data Analysis helps you understand how these measures reveal meaningful insights from complex datasets. Explore the recommended articles below for more tips on data interpretation, business analytics, and practical statistical tools.

