Updated March 6, 2023
Definition of Matlab xlim
Matlab provides different types of functionality to the user; the xlim is one of the functions provided by Matlab. By using the xlim () function, we can set the limit for the x-axis for the current axis or bar, or we can say any type of chart. When we need to specify the limit for the axis, then we need to pass the minimum and maximum values as per our requirement. The main important thing in the xlim () function is that the maximum value in the xlim () function should be greater than the minimum value from the xlim () function. For the implementation of the xlim () function, we have two options, such as automatic or manual limit; we can choose anyone.
Syntax:
xlim(specified limit)

xlim(xlim minimum value, xlim maximum value)
Explanation
There are multiple syntaxes available for the xlim () function; here, we define only two syntaxes.
In the first syntax, we use the xlim () function with the specified limit parameter as shown. By using the specified parameter, we can set the x-axis limit for the current working chart or axes.
In the second syntax, we just simplify the first syntax means that with the help of the two parameters, we can set the limit whatever we require. In this syntax, we define two parameters such as xlim minimum value and xlim maximum value. The xlim of the maximum value is always greater than the xlim minimum value.
How xlim works in Matlab?
Now let’s see how xlim works in Matlab as follows.
Basically, there are two ways to implement the xlim () function in Matlab as follows.
1. Automatic xlim () selection:
In this method, we specify the limit for the current axis or chart by using an automatic way. In this method, we need to specify the automatic method that is tight and padded. After that, we need to enable the auto limit selection. The working of this method is that it selects the limit based on the provided data.
2. Manual xlim () selection:
In this method, we can manually set the xlim for the current chart or axis. Here we need to freeze the x-axis limit with their current values provided by the user.
Now let’s see how we can specify the target axes or chart in the xlim () function as follows.
For selection for the target, we use the xlim method; in this method, we specify the target axes or chart instead of the current axes or chart. In this method, first, we need to set the target value with output mode, either auto or manual, that depends on the user requirement.
Now let’s see how we can set the limit for the x-axis as follows.
We can plot a line by setting the xlim () function that we need to pass the two values to the xlim() function one is minimum, and one is maximum.
Now let’s see how we can use the semiautomatic xlim () function as follows.
In this method, only select the x values, and that value should be greater than 0. Here Matlab automatically selects the maximum limit.
Set xlim () with date:
First, create the chart with the date along with the x-axis and set the limit for a date that means from date to the last date.
Now let’s see how we can specify the tight xlim ():
When we need to adjust the x-axis automatically, then we need to specify the range of x coordinator by using the right method.
Input argument for xlim:
Xlim () function or we can call method, for xlim () function we require two input arguments that xmin and xmax values. In xlim (), we can specify the one limit at the same time Matlab calculates another limit; for automatic calculation, we need to use a tight method with inf.
Examples
Now let’s see the different examples of xlim as follows.
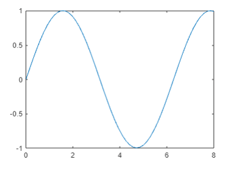
a = linspace(0,15);

b = sin(a);

plot(a,b)

xlim([0 8])
Explanation
In the above example, we use the linspace () function to draw the line. This is a very simple example of xlim (). In the above example, we specify the xlim () function with min and max value, as shown in the above example. The final result of the above statement we illustrated by using the screenshot is as follows.
Now let’s see how we can implement xlim for semi-automatics as follows.
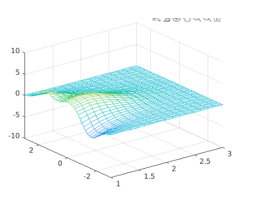
[X,Y,Z] = peaks;

mesh(X,Y,Z)

xlim([1 inf])
Explanation
In the above example, we use the peaks function to implement the graphics functions such as surf, mesh, and color, etc. here;, we use the mesh graphic function as shown. After that, we set the minimum limit of the xlim () function at 1, and at that same time, Matlab calculated the other max limit by using inf. The final result of the above statement we illustrated by using the screenshot is as follows.
Let’s see the example of an axis with the date as follows.
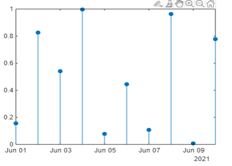
d = datetime(2021,06,1) + caldays(0:10);

x = rand(11,1);

stem(d,x,'filled')

startd = datetime(2021,06,1);

endd = datetime(2021,06,10);

xlim([startd endd])
Explanation
In the above example, we try to set the limit for the x-axis with a date. Here we specify the starting and end date that means a range of dates to create the stem chart as shown in the above example. The final result of the above statement we illustrated by using the screenshot is as follows.
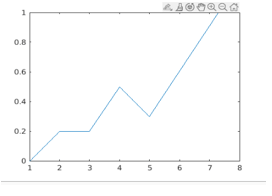
Let’s see the example of xlim tight functions as follows.
First we need to plot the chart by using the following point as follows.
plot([1 2 3 4 5 7.3],[0 0.2 0.2 0.5 0.3 1])
After execution of the above statement, we get the following chart, as shown in the below screenshot as follows.
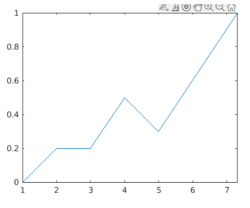
Now execute the xlim tight statement, then we get the following result as shown below screenshot as follows.
So in this way, we can perform the different operations with the help of xlim in Matlab as per our requirement.
Conclusion
We hope from this article you learn Matlab xlim. From the above article, we have learned the basic syntax of xlim, and we also see different examples of xlim. From this article, we learned how and when we use Matlab xlim.
Recommended Articles
This is a guide to Matlab xlim. Here we discuss the Definition, Syntax, How xlim works in Matlab? examples with code implementation. You may also have a look at the following articles to learn more –
