What is Inferential Statistics?
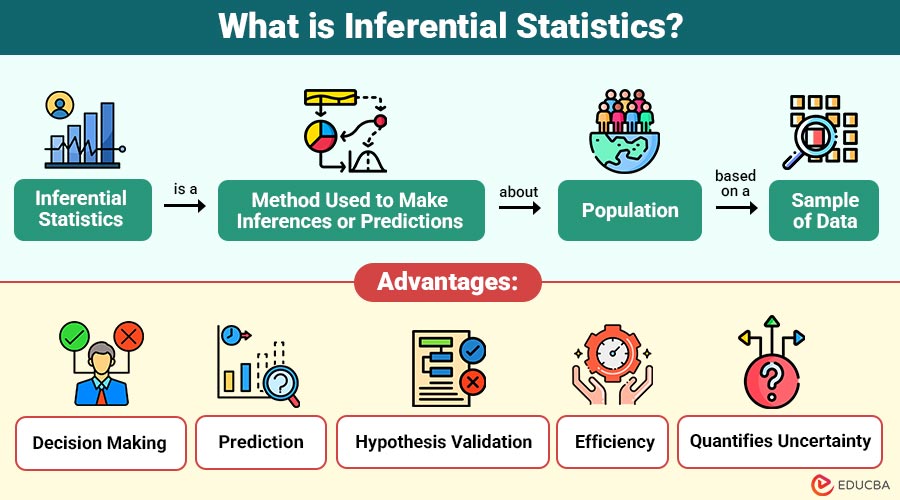
Inferential statistics is a method used to make inferences or predictions about population based on a sample of data. The central idea is that it is often impractical, expensive, or impossible to collect data from an entire population. Instead, analysts gather a sample and use statistical methods to estimate population parameters, test hypotheses, and make predictions.
The key distinction lies in scope:
- Descriptive Statistics: Describes the collected data (mean, median, mode, standard deviation).
- Inferential Statistics: Uses sample data to make generalizations about a population.
Table of Contents:
- Meaning
- Key Concepts
- Methods
- Advantages
- Limitations
- Real-World Applications
- Steps in Conducting Inferential Analysis
Key Takeaways:
- Inferential statistics uses sample data to estimate population parameters and support decision-making under uncertainty.
- Hypothesis testing and confidence intervals effectively quantify uncertainty and assess statistical significance in research.
- Proper sampling methods and adequate sample sizes ensure accurate, reliable, and unbiased statistical conclusions.
- Inferential techniques enable prediction, comparison, and analysis of relationships across healthcare, business, education, and finance sectors.
Key Concepts in Inferential Statistics
Understanding inferential statistics requires familiarity with several core concepts:
1. Population vs. Sample
- Population: The full set of people or noteworthy observations. Example: Every university student.
- Sample: A portion of the population from which conclusions are drawn. Example: 200 randomly selected students from the university.
Sampling ensures cost-effectiveness and efficiency but requires careful design to minimize bias.
2. Parameters vs. Statistics
- Parameter: A numerical characteristic of a population. Example: The average height of all students.
- Statistic: A numerical measure calculated from a sample. Example: The average height of the sampled 200 students.
To estimate population parameters, inferential statistics employ sample statistics.
3. Probability Distributions
Probability distributions describe how data values are spread. In inferential statistics, they help assess the likelihood of observing specific outcomes. Common distributions include:
- Normal Distribution: Bell-shaped, widely used for continuous data.
- Binomial Distribution: Used for outcomes with two possible results, like success or failure.
- t-Distribution: Useful when sample sizes are small or population variance is unknown.
4. Hypothesis Testing
Hypothesis testing is a core inferential method used to make decisions about population parameters. It involves:
- Null Hypothesis (H₀): Assumes no effect or difference exists.
- Alternative Hypothesis (H₁): Assumes a specific effect or difference exists.
- Significance Level (α): The probability of rejecting H₀ when it is true, often set at 0.05.
- p-Value: Determines the strength of evidence against H₀. A p-value below α indicates rejection of the null hypothesis.
5. Confidence Intervals
A range of values that a population parameter is expected to fall within is provided by confidence intervals. For instance, there is a high degree of assurance that the true mean for student height falls within the 95% confidence interval, which may be between 165 and 170 cm.
Common Inferential Statistical Methods
Inferential statistics offers a wide range of techniques, each suited for specific types of data and questions:
1. t-Tests
To ascertain whether there is a significant difference between two groups, t-tests compare their means. Types include:
- Independent t-Test: Compares two unrelated groups.
- Paired t-Test: Compares two related groups, such as measurements before and after treatment.
2. ANOVA (Analysis of Variance)
ANOVA extends t-tests to more than two groups. It tests whether group means differ significantly. For instance, comparing test scores across three classrooms.
3. Chi-Square Test
Chi-square tests analyze categorical data to assess if distributions differ from expected patterns.
4. Regression Analysis
Regression predicts relationships between variables.
- Linear Regression: Examines the relationship between two continuous variables.
- Multiple Regression: Considers multiple independent variables.
It helps forecast outcomes and understand variable influence.
5. Correlation Analysis
Correlation measures the strength and direction of link between two variables. The correlation coefficient (r) has range of -1 to +1. Positive numbers suggest direct ties, while negative values indicate inverse relationships.
Advantages of Inferential Statistics
Inferential statistics provides several key advantages:
1. Decision Making
Enables organizations to make informed decisions using sample data without analyzing entire population datasets comprehensively.
2. Prediction
Helps forecast future trends, behaviors, and outcomes by analyzing patterns observed within representative sample data.
3. Hypothesis Validation
Supports scientific research by testing assumptions and determining whether observed results are statistically significant.
4. Efficiency
Reduces time, cost, and effort by studying smaller samples rather than entire population groups.
5. Quantifies Uncertainty
Provides confidence intervals and p-values to measure reliability, variability, and statistical significance of results.
Limitations of Inferential Statistics
Despite its power, inferential statistics has limitations:
1. Sampling Bias
Unrepresentative or poorly selected samples can produce misleading results, leading researchers to draw incorrect conclusions about the entire population.
2. Assumptions Dependence
Many inferential techniques rely on assumptions such as normality, independence, and equal variance, which may not always hold.
3. Sample Size Sensitivity
Small sample sizes often reduce statistical power, increasing the likelihood of inaccurate estimates and unreliable generalizations.
4. Complexity
Inferential methods require a strong understanding of probability theory, statistical formulas, and interpretation skills to avoid errors.
Real-World Applications
Inferential statistics is widely used across industries:
1. Healthcare
Clinical trials use inferential statistics to evaluate drug safety, effectiveness, and treatment outcomes before approving medications for public use.
2. Business
Marketing teams analyze customer sample data to predict purchasing behavior, demand trends, and overall consumer preferences.
3. Education
Researchers study student sample groups to assess teaching strategies, curriculum effectiveness, and improvements in academic performance.
4. Politics
Polling organizations analyze survey samples to forecast election results and understand public opinion trends.
5. Finance
Financial analysts use sample market data to estimate investment risks, returns, and future economic patterns.
Steps in Conducting Inferential Analysis
Below are steps involved in conducting an effective inferential statistical analysis:
1. Define Research Question
Clearly define the research objective and identify the population parameter or relationship you intend to analyze.
2. Select Sample
Choose a representative sample using appropriate random sampling techniques to ensure unbiased and reliable statistical conclusions.
3. Collect Data
Gather accurate, consistent, and reliable data using validated tools, surveys, experiments, or observational methods.
4. Choose Method
Select a suitable statistical test or estimation technique based on data type, research objective, and assumptions.
5. Perform Analysis
Apply statistical formulas, run hypothesis tests, compute estimates, and analyze results using appropriate software or methods.
6. Interpret Results
Evaluate statistical significance, confidence intervals, effect sizes, and practical implications to determine meaningful conclusions.
7. Report Findings
Present results clearly using tables, charts, and explanations to support informed decision-making and further research.
Final Thoughts
Inferential statistics transforms sample data into meaningful insights about larger populations. It helps researchers, businesses, and policymakers make informed, data-driven decisions without studying entire populations. Although challenges such as sampling bias and model dependence exist, proper methodology ensures reliable results. In today’s data-rich world, inferential statistics remains essential for efficient analysis and smarter decision-making across industries.
Frequently Asked Questions (FAQs)
Q1. Can inferential statistics be used for small datasets?
Answer: Yes, but caution is required. Small samples increase variability, so techniques like t-tests and confidence intervals must account for this.
Q2. How does sample size affect inferential statistics?
Answer: Larger samples reduce uncertainty, increase accuracy, and better represent the population, enhancing the reliability of inferences.
Q3. Can inferential statistics prove causation?
Answer: No. Inferential statistics can show associations and correlations, but proving causation requires controlled experiments or additional evidence.
Q4. Why are probability distributions important in inferential statistics?
Answer: They allow estimation of likelihoods, determination of significance, and calculation of confidence intervals, forming the backbone of inferential analysis.
Recommended Articles
We hope that this EDUCBA information on “Inferential Statistics” was beneficial to you. You can view EDUCBA’s recommended articles for more information.

