SEABORN
Specialization | 5 Course Series | 3 Mock Tests
This Python Seaborn Tutorial includes 5 course with 9+ hours of video tutorials and One year access and several mock tests for practice. You get to learn Seaborn which is a Python data visualization library based on Matplotlib. It provides an interface for attractive and informative statistical graphics and data visualization in Python.
Enroll now and get a FREE Exam Voucher worth $285!
Offer ends in:
What you'll get
- 9+ Hours
- 5 Courses
- Mock Tests
- Course Completion Certificates
- One year access
- Self-paced Courses
- Technical Support
- Mobile App Access
- Case Studies
- Download Curriculum
Synopsis
- Courses: You get access to all the 5 courses, Projects for the Lifetime
- Hours: 9+ Video Hours
- Core Coverage: Learn attractive and informative statistical graphics and data visualization in Python.
- Course Validity: One year access
- Eligibility: Anyone serious about learning Data Visualization and wants to make a career in this Field
- Pre-Requisites: Basic knowledge about Data and analytics and Python programming would be preferable
- What do you get? Certificate of Completion for each of the 5 courses, Projects
- Certification Type: Course Completion Certificates
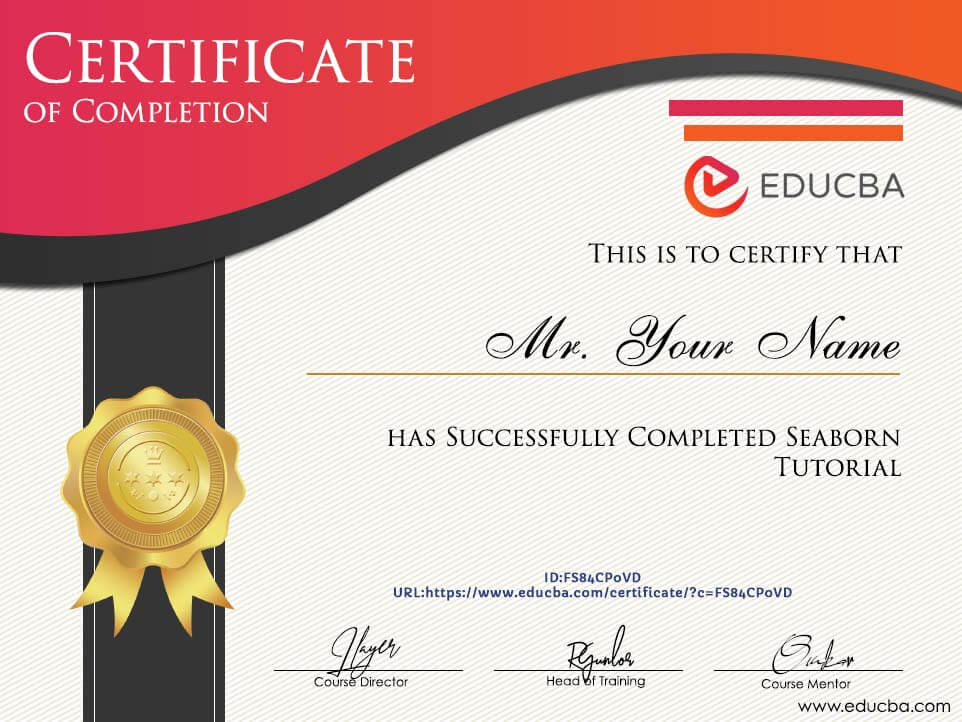
- Verifiable Certificates? Yes, you get verifiable certificates for each course with a unique link. These link can be included in your resume/Linkedin profile to showcase your enhanced data and analytics skills
- Type of Training: Video Course – Self Paced Learning
Content
-
MODULE 1: Seaborn Essentials Training
Courses No. of Hours Certificates Details Seaborn Python - Beginners 2h 28m ✔ Case Studies on Seaborn Python Basics 1h 51m ✔ -
MODULE 2: Learning from Practicals
Courses No. of Hours Certificates Details Seaborn Python - Intermediate 1h 18m ✔ Seaborn Python - Advanced 1h 56m ✔ Seaborn Python Case Study - Data Visualization using Seaborn on Census Dataset 2h 9m ✔ -
MODULE 3: Mock Tests & Quizzes
Courses No. of Hours Certificates Details Test - Python Plotting with Seaborn Minor Test 1 Test - Python Plotting with Seaborn Minor Test 2 Test - Python Plotting with Seaborn Major Test
Description
Through this Python Seaborn Tutorial, you will learn skills and techniques such as plotting and visualization of the various forms of data that are provided to us. This can also be used to refer to the various kinds of datasets and the data frames, which will form an integral part of the data representation. The data frames consist of the data in tabular format and therefore depict the data in a more usable form, which might not be the case otherwise. Other skills are related to the analysis of data and mathematics-related, as all the calculations done after the visualizations are done are mathematics-based.
Sample Certificate

Requirements
- The basic prerequisite for this course is that the student or professional should have a basic knowledge and understanding of the machine learning tools and techniques, as well as a basic knowledge and overview of the data science techniques. Apart from this, he should also be aware of the basic analytical concepts, which are a must while opting for this course. The user should also have a mathematical background, as most of the algorithms being used, and the concepts being discussed are mathematics-based.
Target Audience
- The target audience becomes anybody who is interested in learning this Python Seaborn Tutorial and follows the above-mentioned pre-requisites. This typically includes professionals such as data scientists, data engineers, analysts, consultants, software developers, software engineers, and testers. Apart from these professionals, everybody who is working to build something of their own, such as an entrepreneur, forms an ideal part of the audience, and the students, whether they are directly college graduates or are looking to do something much more creative and bigger, can make use of this course in a much wiser manner.
Enroll now and get a FREE Exam Voucher worth $285!
Offer ends in:
Training 5 or more people?
Get your team access to 5,000+ top courses, learning paths, mock tests anytime, anywhere.
Drop an email at: info@educba.com
