What is Data Interpretation?
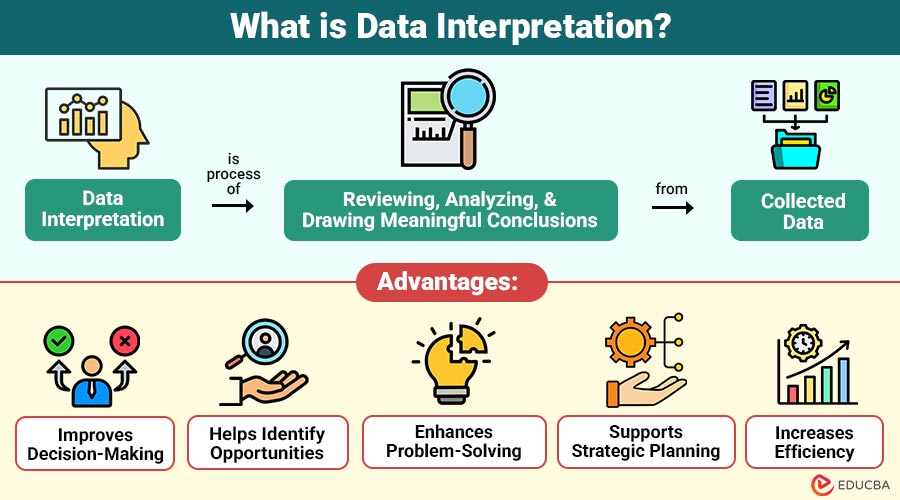
Data interpretation is the process of reviewing, analyzing, and drawing meaningful conclusions from collected data. It involves converting raw numerical or textual data into understandable insights that help individuals and organizations make informed decisions.
In simple terms, data interpretation helps answer questions such as:
- What does the data mean?
- What patterns or trends are present?
- What conclusions can be drawn from the data?
For example, a company analyzing monthly sales data may discover that sales increase during festive seasons. This insight allows the business to plan marketing campaigns and inventory accordingly.
Table of Contents:
Key Takeaways:
- Data interpretation converts raw data into meaningful insights that help organizations make accurate and informed business decisions.
- Effective data interpretation helps identify patterns, trends, and risks, enabling better planning, forecasting, and performance-improvement strategies.
- Both qualitative and quantitative data interpretation methods are used to effectively understand descriptive and numerical information.
- Proper data interpretation requires clean data, correct methods, and skilled professionals to avoid errors and wrong conclusions.
Importance of Data Interpretation
Data interpretation is essential because it converts data into actionable knowledge. Without interpretation, data remains a collection of numbers without context.
1. Better Decision-Making
By converting raw data into insightful knowledge that successfully directs operations, strategic planning, and upcoming business initiatives, data interpretation aids organizations in making appropriate judgments.
2. Identifying Trends and Patterns
Through data interpretation, businesses can identify patterns, trends, and changes in customer behavior, market demand, and performance, helping them develop better growth strategies.
3. Risk Reduction
Interpreting data enables organizations to identify potential risks, errors, and weaknesses early, allowing them to take preventive measures and avoid financial losses or operational problems.
4. Performance Evaluation
Helps measure performance by analyzing results across employees, sales, marketing campaigns, and productivity, enabling organizations to improve efficiency and achieve goals.
5. Competitive Advantage
Organizations that interpret data effectively gain a competitive advantage by making faster, smarter, and more informed decisions, helping them stay ahead in rapidly changing markets.
Types of Data Interpretation
Data interpretation can be categorized into two main types.
1. Qualitative Data Interpretation
Qualitative data interpretation is process of analyzing non-numeric information, such as opinions, feedback, interviews, and observations, to understand human behavior, experiences, meanings, and patterns in descriptive data.
Examples:
- Customer reviews
- Social media comments
- Survey responses
- Interview transcripts
This type of interpretation helps understand human behavior, opinions, and experiences.
2. Quantitative Data Interpretation
Quantitative data interpretation is the process of analyzing numerical data using statistical methods such as averages, percentages, and comparisons to identify trends, relationships, patterns, and measurable business performance results.
Examples:
- Sales numbers
- Website traffic data
- Market share percentages
- Financial reports
Statistical methods such as averages, percentages, and correlations are commonly used in quantitative interpretation.
Methods of Data Interpretation
Several techniques are used to interpret data effectively.
1. Statistical Analysis
Statistical analysis involves using mathematical techniques such as mean, median, mode, correlation, and standard deviation to summarize data, identify patterns, and understand relationships in large datasets.
2. Graphical Representation
Graphical representations use visual tools such as bar charts, line graphs, pie charts, histograms, and scatter plots to present data clearly and facilitate interpretation.
3. Comparative Analysis
Comparative analysis is the process of looking at two or more datasets to find similarities and differences. This helps businesses assess performance, track progress, and make better decisions.
4. Trend Analysis
Businesses may accurately forecast demand, growth, performance, and possible market changes by using trend analysis, which looks at historical data over time to find trends and forecast future results.
Tools Used for Data Interpretation
Various tools and software help professionals analyze and interpret data efficiently.
1. Microsoft Excel
One of the most popular programs for interpreting data is Microsoft Excel. It provides features like:
- Pivot tables
- Charts
- Data filters
- Statistical formulas
Analysts, accountants, and researchers commonly use Excel.
2. Tableau
Tableau is a robust data visualization application that facilitates the creation of visual reports and interactive dashboards. Organizations use Tableau to interpret complex datasets quickly and share insights across teams.
3. Power BI
A corporate analytics solution called Power BI transforms data into reports and dashboards. It integrates with multiple data sources and helps organizations monitor performance metrics.
4. Python and R
Programming languages like R and Python are used for advanced data analysis and interpretation. They enable analysts to create prediction models and handle massive datasets.
Steps in the Data Interpretation Process
The process of interpreting data generally involves several steps.
Step 1: Data Collection
The first step is to gather data from reliable sources, such as surveys, databases, and research studies.
Step 2: Data Cleaning
Raw data often contains errors, duplicates, or missing values. Data cleaning ensures accuracy and consistency.
Step 3: Data Analysis
The cleaned data is analyzed using statistical methods, algorithms, or analytical tools.
Step 4: Data Visualization
Charts, graphs, and dashboards are created to make the data easier to understand.
Step 5: Drawing Conclusions
Finally, insights and conclusions are derived from the analysis of the data to support decision-making.
Real-World Applications of Data Interpretation
Data interpretation is used in many industries and fields.
1. Business and Marketing
Companies analyze customer behavior, purchasing trends, and marketing campaign results to improve strategies.
2. Finance
Financial institutions interpret data to evaluate investments, assess risks, and monitor economic trends.
3. Healthcare
Healthcare professionals interpret medical data to diagnose diseases and improve patient care.
4. Education
Educational institutions use data interpretation to evaluate student performance and improve teaching methods.
Advantages of Data Interpretation
Here are some key advantages of data interpretation that help organizations make better decisions and improve overall performance.
1. Improves Decision-Making
Data interpretation converts raw information into meaningful insights, helping organizations make accurate, informed, and timely decisions that improve overall performance and reduce operational uncertainty.
2. Helps Identify Opportunities
By analyzing interpreted data, organizations can discover new market opportunities, customer needs, and business possibilities, enabling them to expand, innovate, and increase profitability.
3. Enhances Problem-Solving
By examining data and trends, it assists in determining the underlying causes of challenges, allowing organizations to develop workable solutions and avoid reoccurring problems.
4. Supports Strategic Planning
Organizations use interpreted historical and current data to create long-term plans, set realistic goals, allocate resources properly, and make strategies that support sustainable growth.
5. Increases Efficiency
It helps organizations improve efficiency by identifying unnecessary processes, optimizing resource usage, reducing waste, and improving productivity through better planning and performance analysis.
Disadvantages of Data Interpretation
Here are some common disadvantages that organizations may face while analyzing and using data for decision-making.
1. Risk of Misinterpretation
It may produce incorrect conclusions if analysis is biased, assumptions are wrong, or methods are misused, leading to poor decisions and negative outcomes.
2. Data Quality Issues
If data is incomplete, outdated, or inaccurate, the interpretation results may be unreliable, causing wrong insights, poor planning, and ineffective business decisions and strategies.
3. Time-Consuming Process
Large-scale data interpretation takes a lot of time, effort, and processing power, particularly when the datasets are complicated, unstructured, or gathered from several sources.
4. Requires Skilled Professionals
Effective data interpretation requires trained professionals with knowledge of statistics, analytical tools, and domain expertise, which may increase cost and dependency on specialized employees.
5. Overdependence on Data
Relying too heavily on data interpretation may overlook human intuition, experience, and qualitative factors, which are sometimes necessary for balanced, practical decision-making in organizations.
Final Thoughts
Data interpretation is a vital process that transforms raw data into valuable insights. Effective data analysis and comprehension enables firms to recognize trends, make well-informed decisions, and enhance performance. Whether in business, healthcare, education, or finance, data interpretation plays a crucial role in solving problems and guiding strategies. As the volume of data continues to grow in the digital age, the ability to interpret data accurately will remain one of the most important skills for professionals across industries.
Frequently Asked Questions (FAQs)
Q1. What skills are required for effective data interpretation?
Answer: Effective data interpretation requires analytical thinking, basic statistical knowledge, attention to detail, and the ability to use tools like Excel or Power BI, along with good communication skills.
Q2. Why is data interpretation important in business?
Answer: It helps businesses understand customer behavior, market trends, and operational performance, enabling better strategic decisions.
Q3. Can small businesses benefit from data interpretation?
Answer: Yes, Small businesses can benefit from data interpretation by analyzing sales, feedback, and marketing data to understand customers, reduce risks, improve strategies, and make better decisions.
Recommended Articles
We hope that this EDUCBA information on “Data Interpretation” was beneficial to you. You can view EDUCBA’s recommended articles for more information.

