Updated May 24, 2023
Covariance Formula (Table of Contents)
What is Covariance Formula?
The covariance formula is one of the statistical formulae used to determine the relationship between two variables, or we can say that covariance shows the statistical relationship between two variances between the two variables.
The positive covariance states that two assets moving together give positive returns, while negative covariance means returns move in the opposite direction. Covariance is usually measured by analyzing standard deviations from the expected return, or we can obtain it by multiplying the correlation between the two variables by the standard deviation of each variable.
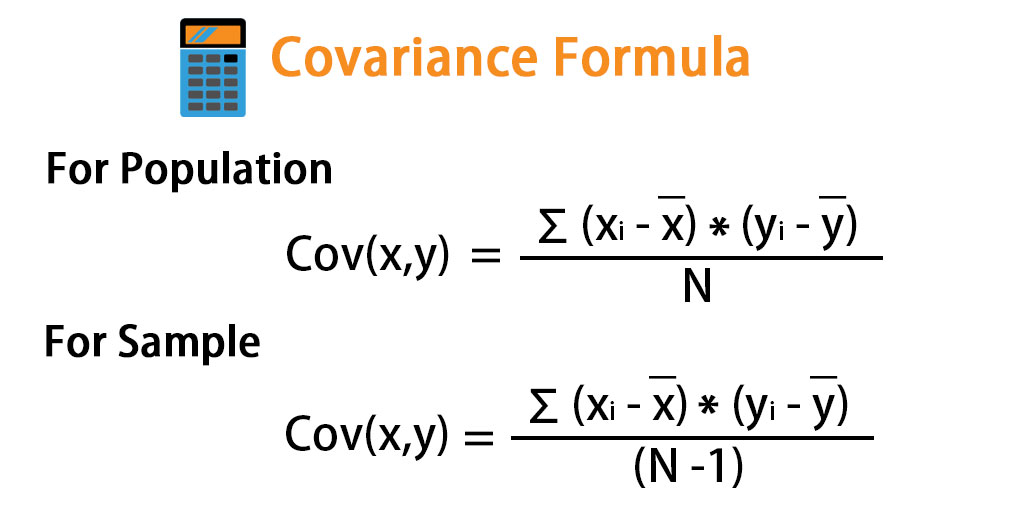
Population Covariance Formula
Sample Covariance Formula
Where
- xi = Data variable of x
- yi = Data variable of y
- x = Mean of x
- y = Mean of y
- N= Number of data variables.
How is the Correlation Coefficient formula correlated with Covariance Formula?
Correlation = Cov(x,y) / (σx * σy)
Where:
- Cov(x,y): Covariance of x & y variables.
- σx = Standard deviation of the X- variable.
- σy = Standard deviation of the Y- variable.
However, Cov(x,y) defines the relationship between x and y, while and. Now, we can derive the correlation formula using covariance and standard deviation. The correlation measures the strength of the relationship between the variables. At the same time, one cannot measure the scaled covariance measure in a specific unit. Hence, it is dimensionless.
If the correlation is 1, they move perfectly together; if the correlation is -1, then the stock moves perfectly in opposite directions. Or if there is zero correlation, then no relationship exists between them.
Examples of Covariance Formula
Let’s take an example to understand the calculation of covariance in a better manner.
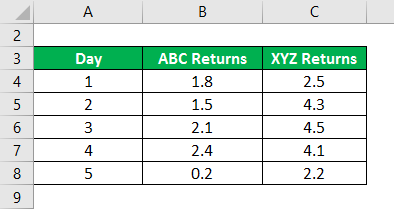
Covariance Formula – Example #1
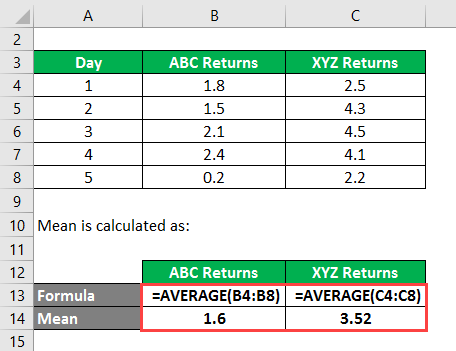
Daily Closing Prices of Two Stocks are arranged as per returns. So calculate covariance.
The Mean is calculated as follows:
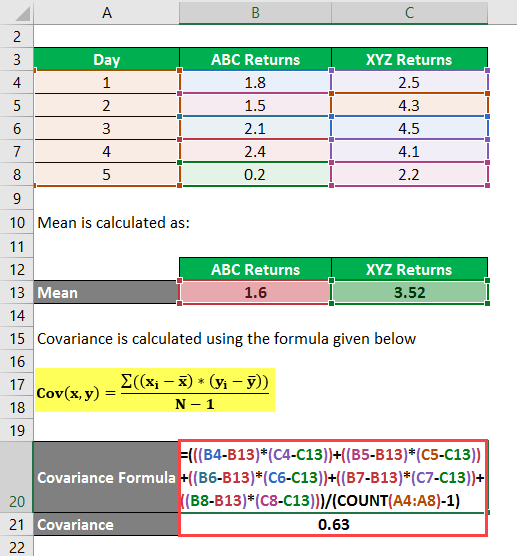
Covariance is calculated using the formula given below
Cov(x,y) = Σ ((xi – x) * (yi – y) / (N – 1)
- Cov(x,y) =(((1.8 – 1.6) * (2.5 – 3.52)) + ((1.5 – 1.6)*(4.3 – 3.52)) + ((2.1 – 1.6) * (4.5 – 3.52)) + (2.4 – 1.6) * (4.1 – 3.52) + ((0.2 – 1.6) * (2.2 – 3.52))) / (5 – 1)
- Cov(x,y) = ((0.2 * (-1.02)) +((-0.1) * 0.78)+(0.5 * 0.98) +(0.8 * 0.58)+((-1.4) * (-1.32)) / 4
- Cov(x,y) = (-0.204) + (-0.078) + 0.49 + 0.464 + 1.848 / 4
- Cov(x,y) = 2.52 / 4
- Cov(x,y) = 0.63
The covariance of the two stocks is 0.63. The positive outcome shows that the two stocks will move together in a positive direction, or we can say that if ABC stock is booming, then XYZ also has a high return.
Covariance Formula – Example #2
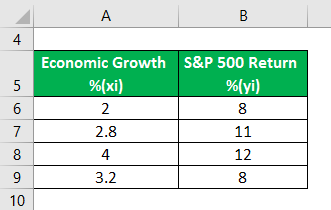
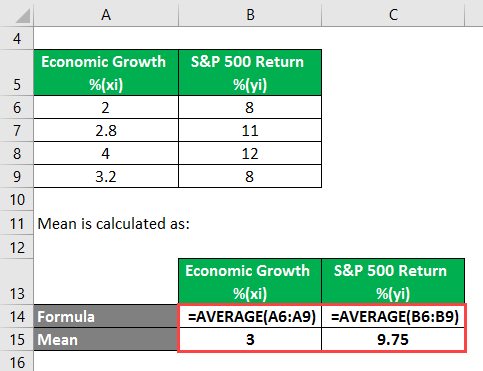
The table below describes the rate of economic growth(xi) and return(yi) on the S&P 500. With the help of the covariance formula, determine whether economic growth and S&P 500 returns have a positive or inverse relationship. Calculate the mean value of x and y as well.
The Mean is calculated as follows:
Covariance is calculated using the formula given below
Cov(x,y) = Σ ((xi – x) * (yi – y) / N
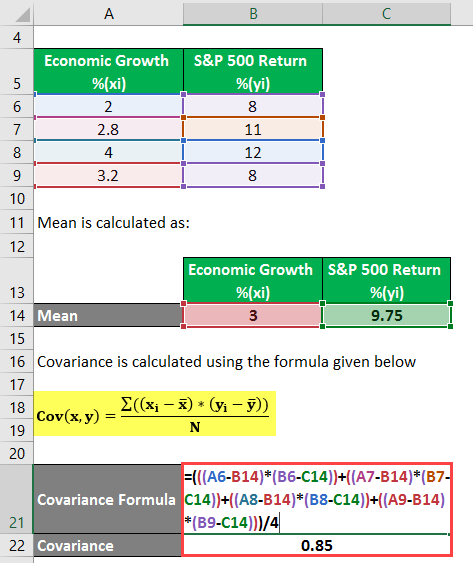
- Cov(X,Y) = (((2 – 3) * (8 – 9.75))+((2.8 – 3) * (11 – 9.75))+((4-3) * (12 – 9.75))+((3.2 – 3) * (8 – 9.75))) / 4
- Cov(X,Y) = (((-1)(-1.75))+((-0.2) * 1.25)+(1 * 2.25)+(0.2 * (-1.75))) / 4
- Cov(X,Y) = (1.75 – 0.25 + 2.25 – 0.35) / 4
- Cov(X,Y) = 3.4 / 4
- Cov(X,Y) = 0.85
Covariance Formula – Example #3
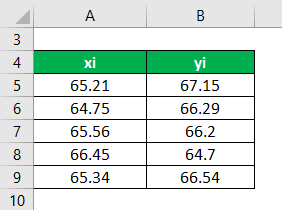
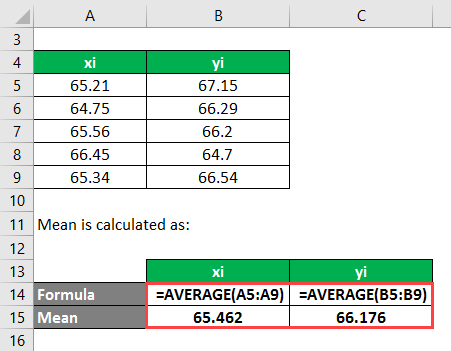
Consider datasets X = 65.21, 64.75, 65.56, 66.45, 65.34, and Y = 67.15, 66.29, 66.20, 64.70, 66.54. Calculate the covariance between the two data sets, X & Y.
Solution:
The Mean is calculated as follows:
Covariance is calculated using the formula given below
Cov(x,y) = Σ ((xi – x) * (yi – y) / (N – 1)
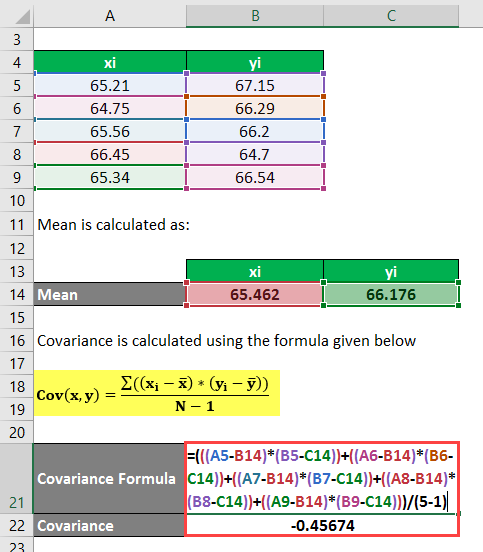
- Cov(X,Y) = (((65.21 – 65.462) * (67.15 – 66.176)) + ((64.75 – 65.462) * (66.29 – 66.176)) + ((65.56 – 65.462) * (66.20 – 66.176)) + ((66.45 – 65.462) * (64.70 – 66.176)) + ((65.34 – 65.462) * (66.54 – 66.176))) / (5 – 1)
- Cov(X,Y) = ((-0.252 * 0.974) + (-0.712 * 0.114) + (0.098 * 0.024) + (0.988 * (-1.476)) + (-0.122 * 0.364)) /4
- Cov(X,Y) = (- 0.2454 – 0.0811 + 0.0023 – 1.4582 – 0.0444) / 4
- Cov(X,Y) = -1.8268 / 4
- Cov(X,Y) = -0.45674
Explanation
Covariance, applied to the portfolio, must determine what assets are included. The outcome of the covariance decides the direction of movement. If it is positive, stocks moving in the same or opposite directions lead to negative covariance. The portfolio manager selects the stocks that perform well together, which usually means that these stocks are expected not to move in the same direction.
While calculating covariance, we need to follow predefined steps as such:
Step 1: Initially, we need to find a list of previous or historical prices published on the quote pages. To initialize the calculation, we need the closing price of both the stocks and build the list.
Step 2: Next, calculate the average return for both stocks:
Step 3: After calculating the average, we take a difference between the returns ABC, return, and ABC’s average return similarly between XYZ and XYZ’s return average return.
Step 4: We divide the outcome with sample size and subtract one.
Relevance and Uses of Covariance Formula
Covariance is one of modern portfolio theory’s most important (MPT) measures. MPT helps to develop an efficient frontier from a mix of assets that forms the portfolio. Investors use the efficient frontier to ascertain the maximum return for a given level of risk associated with the overall combined assets in a portfolio. The objective is to select the assets with a lower standard deviation of the combined portfolio rather than individual assets’ standard deviation. This minimizes the volatility of the portfolio. The objective of the MPT is to create an optimal mix of a higher-volatility assets with lower-volatility assets. By creating a portfolio of diversifying assets, the investors can minimize the risk and allow for a positive return.
While constructing the overall portfolio, we should incorporate some of the assets having negative covariance, which helps minimize the portfolio’s overall risk. Analyst most occasionally prefers to refer to historical price data to determine the measure of covariance between different stocks. And aspects of the same trend affecting asset prices will continue, which is not always possible. Including assets of negative covariance helps minimize the portfolio’s overall risk.
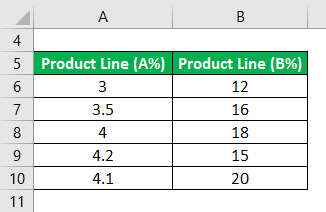
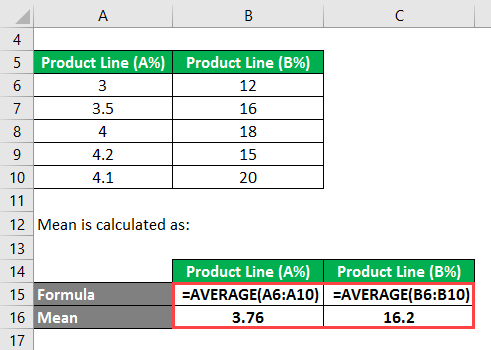
Covariance Formula in Excel (With Excel Template)
Here we will do another example of the Covariance in Excel. It is very easy and simple.
An analyst has five quarterly performance dataset of a company that shows the quarterly gross domestic product(GDP). While growth is in percentage(A) and a company’s new product line growth in percentage (B). Calculate the Covariance.
You calculate the Mean using the following method:
To calculate covariance, you use the following formula:
Cov(x,y) = Σ ((xi – x) * (yi – y) / (N – 1)
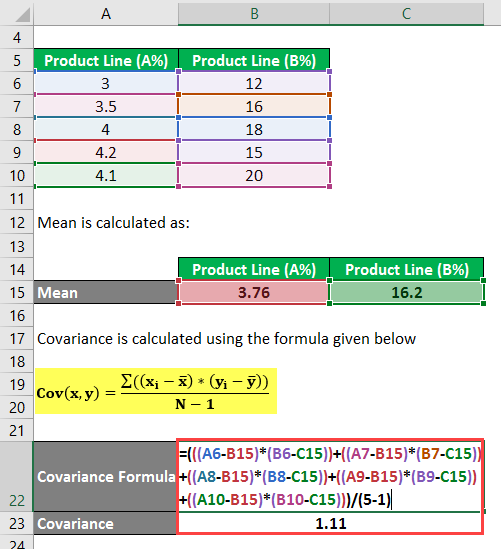
- Cov(X,Y) = (((3 – 3.76) * (12 – 16.2)) + ((3.5 – 3.76) * (16 – 16.2)) + ((4 – 3.76) * (18 – 16.2)) + ((4.2 – 3.76) * (15 – 16.2)) +((4.1 – 3.76) * (20 – 16.2))) / (5 – 1)
- Cov(X,Y) = (((-0.76) *(-4.2)) + ((-0.26) * (-0.2)) + (0.24 *1.8) + (0.44 * (-1.2)) + (0.34 *3.8)) / 4
- Cov(X,Y) = (3.192 + 0.052 +0.432 – 0.528 + 1.292) /4
- Cov(X,Y) = 4.44 / 4
- Cov(X,Y) = 1.11
Recommended Articles
This has been a guide to Covariance Formula. Here we discuss calculating covariance, practical examples, and a downloadable Excel template. You may also look at the following articles to learn more –
