What is Cohort Analysis?
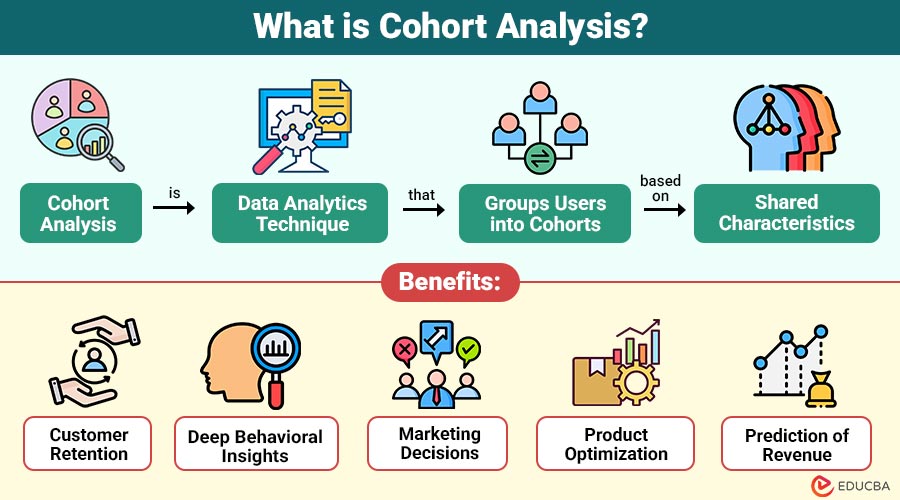
Cohort analysis is data analytics technique that groups users into cohorts based on shared characteristics. It then examines how the behavior of these cohorts changes over different time periods. A cohort is simply a group of users who experienced a common event during the same timeframe.
Examples:
- Users who signed up in January 2025.
- Customers who purchased a product category for the first time.
- App users who completed onboarding in the same week.
- Subscribers who began a free trial on the same day.
By analyzing these groups separately, businesses can better understand customer behavior rather than relying on broad averages.
Table of Contents:
Key Takeaways:
- Cohort analysis reveals precise retention trends by tracking specific user groups instead of general average behavior patterns.
- It uncovers detailed behavioral insights, showing actual user actions and patterns beyond basic click or usage data.
- Cohort analysis guides marketing decisions by identifying campaigns that attract and retain valuable, long-term customer segments.
- Tracking cohorts over time helps optimize products, reduce churn, and accurately predict revenue across different user segments.
Why does Cohort Analysis Matter?
Here are the key reasons why cohort analysis matters and how it benefits your business:
1. Improves Retention
Tracking how each cohort retains over time reveals whether your product is actually sticky and which groups are churning.
2. Identifies Product Issues
Sudden drops in engagement for a specific cohort may indicate onboarding problems, bugs, or UX friction.
3. Enables Targeted Marketing
You can tailor campaigns for early, mid, or returning-stage cohorts to boost conversions.
4. Shows Long-Term Customer Value
Analyzing cohort-level revenue helps calculate Customer Lifetime Value (CLV) more accurately.
5. Reveals User Behavior Trends
Behavioral cohorts help uncover usage patterns, feature adoption rates, and signals of customer loyalty.
Types of Cohort Analysis
Cohort analysis can be classified into three major types depending on the business goal.
1. Acquisition Cohorts
Groups users by the time they first joined, helping track retention, churn, and long-term engagement trends.
Examples:
- Customers who registered in Q1 2025
- App installs from a specific campaign
- Website users from a particular week
Purpose: Understand retention, churn, and long-term engagement.
2. Behavioral Cohorts
Group users by the specific actions they perform, enabling analysis of engagement patterns and the effectiveness of feature adoption.
Examples:
- Users who completed onboarding
- Customers who made repeat purchases
- Players who reached level 10 in a game
Purpose: Analyze engagement patterns and feature adoption.
3. Segment-Based Cohorts
Groups users by demographics or attributes, allowing personalized experiences and measuring performance across different user categories.
Examples:
- Users aged 18–25
- Customers from Tier-1 cities
- Enterprise vs. SMB clients
Purpose: Personalize experiences and measure performance across user categories.
How does Cohort Analysis Work?
Implementing cohort analysis involves a simple but structured process.
Step 1: Define the Cohort Criteria
Choose the shared attribute that forms each cohort:
- Signup date
- First purchase
- Marketing source
- Behavior milestone
Step 2: Choose Time Intervals
Decide how you will measure changes:
- Daily
- Weekly
- Monthly
- Quarterly
Step 3: Build a Cohort Table
A cohort table maps performance metrics over time, often using a heatmap.
- Columns represent time elapsed (Week 1, Week 2…)
- Rows represent each cohort (Jan users, Feb users…)
Step 4: Track Key Metrics
Depending on the goal, metrics may include:
- Retention rate
- Churn rate
- Revenue per cohort
- Engagement frequency
- Order value
- Feature adoption
Step 5: Compare Cohorts Over Time
Look for:
- Improving retention patterns
- Declining engagement in certain cohorts
- Successful acquisition channels
- Seasonal behaviors
- Behavioral differences
This comparison reveals insights that raw totals cannot.
Key Metrics Used in Cohort Analysis
Cohort analysis becomes powerful when combined with the right metrics.
1. Retention Rate
Measures the percentage of users returning after signup, indicating loyalty and continued engagement with the product.
2. Churn Rate
Shows the proportion of consumers that discontinue using a product, indicating possible problems with retention or discontent.
3. Revenue Per Cohort
Calculates total and recurring revenue generated by a specific cohort, measuring financial contribution over time.
4. Customer Lifetime Value
Estimates the long-term profitability of each cohort by predicting total revenue from individual customers.
5. Repeat Purchase Rate
Tracks the proportion of users making multiple purchases, crucial for subscription-based or e-commerce business success.
6. Engagement Metrics
Analyzes user actions, such as clicks, session duration, and completed activities, to assess product interaction and engagement.
Benefits of Cohort Analysis
Here are the key benefits of cohort analysis, with specific insights and practical applications:
1. Customer Retention
Cohort analysis isolates trends for specific user groups, providing clearer, more precise retention measurements.
2. Deep Behavioral Insights
It uncovers detailed user actions and patterns, showing what customers actually do, not just click behavior.
3. Marketing Decisions
Analyzing cohorts helps identify which campaigns attract and retain long-term, valuable customers for better marketing strategies.
4. Product Optimization
Cohort insights reveal friction points and onboarding challenges, enabling product improvements for smoother customer experiences.
5. Prediction of Revenue
Group-wise cohort analysis allows forecasting revenue trends and stability by understanding performance across specific customer segments.
Challenges of Cohort Analysis
Here are the challenges businesses may face when implementing cohort analysis, along with their practical implications:
1. Data Complexity
Accurate cohort analysis depends on clean, complete, and consistent user data, which can be difficult to maintain.
2. Tooling & Technical Effort
Implementing cohort analysis often requires advanced analytics tools or SQL expertise, adding technical complexity for teams.
3. Interpretation Errors
Misunderstanding cohort trends or patterns can lead to incorrect conclusions and poor business or marketing decisions.
4. Time-Consuming for Large Businesses
Handling large datasets increases the complexity of cohort analysis, making modeling, maintenance, and updates more time-intensive and challenging.
Cohort Analysis Example
Here is an example illustrating how cohort analysis tracks user retention over time:
Suppose 500 users sign up in January (Cohort A).
Over the next 3 months:
- 300 remain active in Month 1
- 180 remain active in Month 2
- 120 remain active in Month 3
Retention becomes:
- Month 1: 60%
- Month 2: 36%
- Month 3: 24%
Comparing this with February or March cohorts helps understand if product changes improved retention.
Final Thoughts
Cohort analysis helps businesses understand customer behavior, improve retention, optimize marketing, and enhance products. By grouping users into meaningful cohorts and tracking behavior over time, companies gain insights unseen in general analytics. Applicable to e-commerce, SaaS, apps, gaming, or education platforms, it enables smarter, data-driven decisions and serves as a key tool for long-term growth and customer success.
Recommended Articles
We hope that this EDUCBA information on “Cohort Analysis” was beneficial to you. You can view EDUCBA’s recommended articles for more information.

