


Updated October 15, 2026
Think about the last thing you learned that actually stuck: how a coffee machine works, what to do with a monthly budget, why bread rises. Chances are someone showed you a simple chart instead of a wall of text. That is the power of visual learning. AI educational charts make it easier to turn complex ideas into clear, engaging visuals. An AI picture generator like Dreamina can help you make one in minutes.
You do not need design software or a graphics background, just a clear idea and a prompt. This post walks through planning a chart, getting it generated, and polishing it into something that teaches.
Why AI Educational Charts Make Learning Easier?
Our brains process images quickly, and a good layout shows relationships that sentences struggle to explain. Steps become a path, comparisons become two columns, and cause and effect becomes an arrow. For everyday learning, like a study guide, a classroom poster, or a quick how-to for your family group chat, that clarity matters more than polish.
Visual explanations also stay with learners longer, which is why teachers keep drawing on whiteboards. A simple chart people actually read beats a gorgeous one they scroll past. Even a rough draft makes a point faster than a paragraph does.
What Seedream 5.0 Pro Offers for Creating Educational Charts?
Educational charts mix pictures, text, and structure, and that is where Seedream 5.0 Pro earns its place.
1. Layers for Subjects, Text, and Backgrounds
The model separates visual elements into layers, which makes it easier to adjust a heading or swap a background without disturbing everything else. That saves you from regenerating a whole chart for one typo.
2. Prompts in 14 Languages
You can write in 14 languages, so a chart for a multilingual classroom or community does not need a translator before you start.
3. Research that Backs Up the Details
Built-in online research helps the model pull in accurate, up-to-date information, which is useful for facts, trends, and branded details. Still, a quick check never hurts.
4. Precise Edits at 2K
Point selection, lasso, and sketch guidance let you correct one region at a time, and 2K output keeps small text sharp. That is a big help for charts with tiny labels.
Pick One Idea Per Chart
The most common mistake is trying to teach too much at once. Choose a single idea and build around it. Some good starting points:
- How recycling sorts paper, plastic, and glass
- A weekly meal schedule with a grocery list
- The water cycle, from puddle to cloud
- How to read a nutrition label
- Bike maintenance in five steps
If you cannot summarize the chart in one sentence, it is probably two charts. Keep titles under eight words.
How to Create an Educational Chart With Dreamina in Three Steps?
Once you have selected a topic, you can use Dreamina to turn your idea into a visual learning resource.
Step 1: Enter a Text Prompt for Your Recycling Chart
Enter Dreamina and describe the topic, structure, and style of your chart. For example: An educational chart called ‘How Recycling Works’ with five steps on a winding path: collect, sort, clean, process, reuse. Simple flat icons of bins, bottles, and paper, a green and white color palette, large readable headings, short captions under each icon, plenty of white space, vertical poster layout. Mention the number of steps, since the model follows structure well.
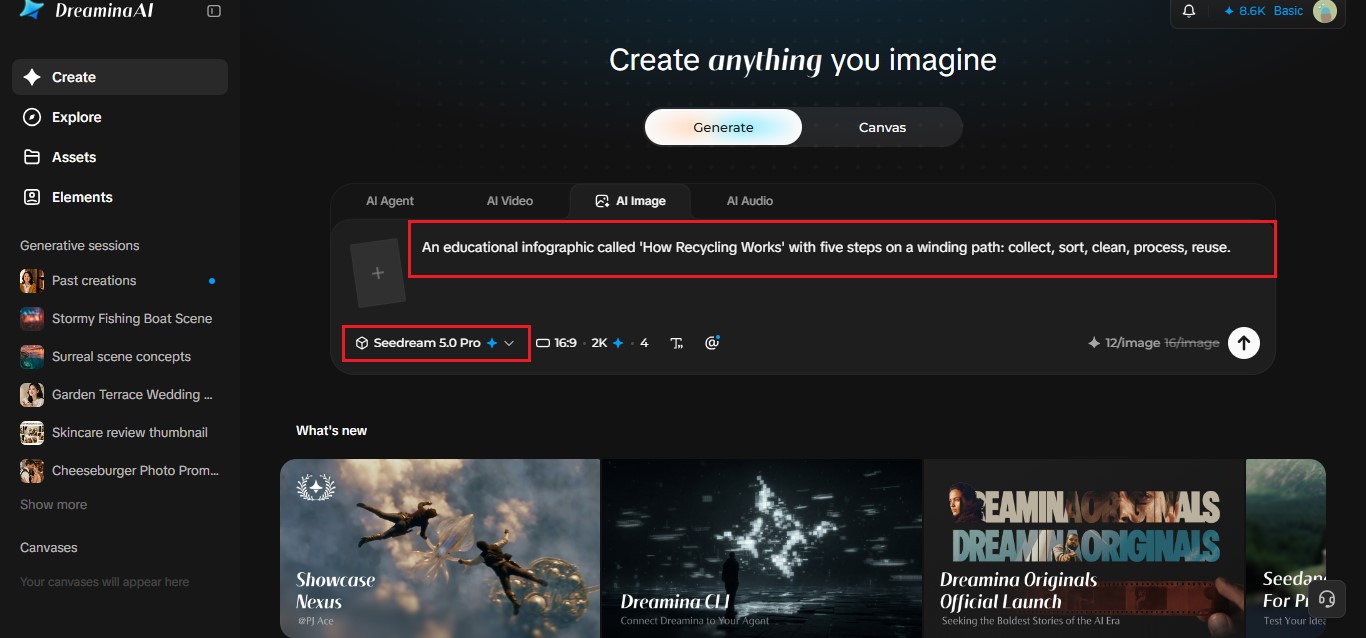
Image Source: Dreamina AI
Step 2: Adjust Parameters and Generate
Pick your model, choose an aspect ratio (vertical works well for posters and phone screens), set the size, and select either 1K or 2K resolution. Then click Dreamina’s icon to generate your recycling chart. Choose 2K whenever your chart includes small text, like the captions under each step. Try a draft at 1K first to check the layout.
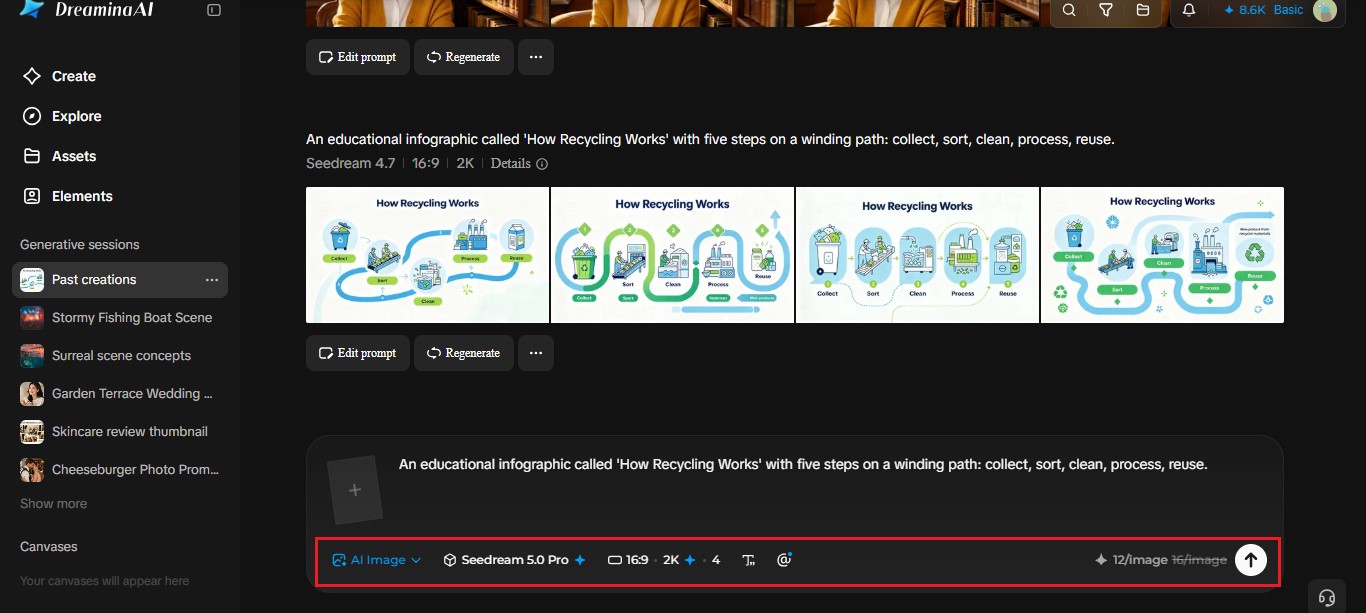
Image Source: Dreamina AI
Step 3: Customize and Download
Fine-tune your “How Recycling Works” chart with Dreamina’s AI options. Inpaint fixes a single area, such as a garbled caption under “Sort.” Expand adds room around the layout, remove clears clutter, and retouch cleans up rough edges. When you are satisfied, click the Download icon to save your chart. Small fixes usually beat starting over.
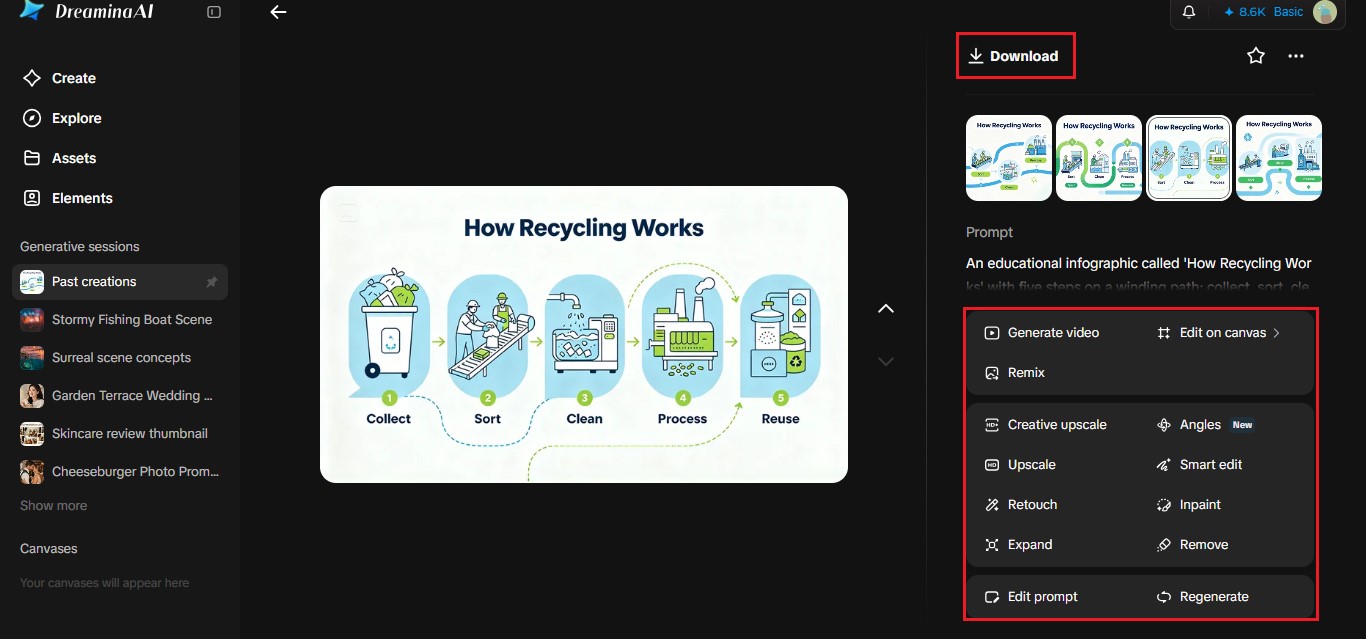
Image Source: Dreamina AI
Layout that Guides the Eye
Readers move through a chart in a pattern, usually top to bottom and left to right. Use that. Put the title at the top, number the steps (collect, sort, clean, process, reuse), and leave breathing room between sections. Ask for “plenty of white space” and “clear visual hierarchy” in your prompt. If something feels crowded, remove an element instead of shrinking everything. Fewer items, bigger and clearer, almost always teach better.
Color helps too: Give each type of information its own color, like steps in green and tips in orange. Test it by squinting. If the main idea still shows, the hierarchy works.
Keeping Text Readable
Text is the hardest part of any generated chart. Keep headings short, captions shorter, and ask for large, clean lettering with strong contrast against the background. Avoid long sentences inside the image. If a caption comes out garbled, use inpainting to redraw just that area, or leave the space blank and add your own text in a simple editor afterward. Two-word labels often render better than full sentences.
Check the Facts Before You Share
A good-looking chart can still be wrong. Even with built-in research, read every label, number, and step before you publish. For a recycling chart, that means confirming your local rules on what goes in which bin. Compare the content against a trusted source, especially for health, money, or safety topics.
If something is off, fix the prompt or edit the region and generate again. Accuracy is what turns a pretty picture into something people can rely on. Ask a friend to read it cold and tell you what they learned. If they miss the point, your chart needs work.
Final Thoughts
The best AI educational charts start with a question someone actually has. Dreamina and Seedream 5.0 Pro make it easy to turn the answer into a clear, shareable chart without design experience. Pick a topic you know well, write your prompt, and see how it looks. Teaching has never been this quick. Share it with someone who is asking.