


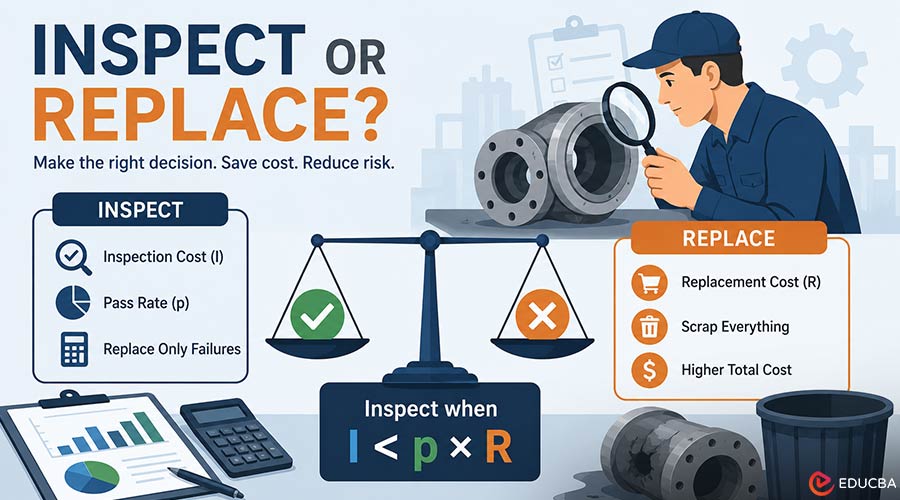
Every maintenance and operations function faces the same recurring decision: a component has come out of service, and somebody has to decide whether to inspect it or scrap it. The inspect or replace decision is often made based on experience and judgment. However, it can also be made using straightforward arithmetic. This article walks through the calculation, the two inputs it depends on, and the mistakes that make the answer wrong.
The Inspect or Replace Decision, Explained
The correct comparison is not “inspection cost versus replacement cost.” That framing leads to the wrong calculation, which is why people often abandon it. Instead, compare two complete policies applied to a batch of components:
- Policy A — scrap everything: Total cost = N × R, where N is the number of components condemned, and R is the replacement cost of one.
- Policy B — inspect everything, replace only the failures: Total cost = (N × I) + (N × (1 − p) × R), where I is the fully loaded inspection cost per component and p is the proportion that pass.
Policy B wins when (N × I) + (N × (1 − p) × R) < N × R. Cancel N from every term and the whole thing collapses to a single condition:
I < p × R
Inspection is worth doing when its cost is less than the replacement cost multiplied by the pass rate. Rearranged for the break-even pass rate: p > I / R.
If inspection costs 18 percent of replacement, inspection pays as soon as more than 18 percent of condemned components turn out to be serviceable. That is the entire model. Everything else is estimating the two inputs honestly.
A Worked Numerical Example
Take an operation that condemns 600 high-value components a year, each costing 10,000 to replace.
Policy A: 600 × 10,000 = 6,000,000.
Policy B, with inspection at 1,800 per component (18 percent of replacement) and a pass rate of 35 percent:
- Inspection: 600 × 1,800 = 1,080,000
- Failures to replace: 600 × 0.65 = 390 components
- Replacement: 390 × 10,000 = 3,900,000
- Total: 4,980,000
Policy B saves 1,020,000 a year about 17 percent of the replacement budget through a process change that requires no new technology and no supplier renegotiation. Check it against the condition: I = 1,800, p × R = 0.35 × 10,000 = 3,500. Since 1,800 < 3,500, Policy B wins, as the full calculation shows.
Sensitivity: Why the Answer is Fragile?
The model has only two inputs, so it is worth knowing how hard each one pushes. At a 35 percent pass rate, the saving is 1,020,000. Drop the pass rate to 20 percent, and it falls to 120,000. At 18 percent, it is zero. Below that, inspecting actively loses money.
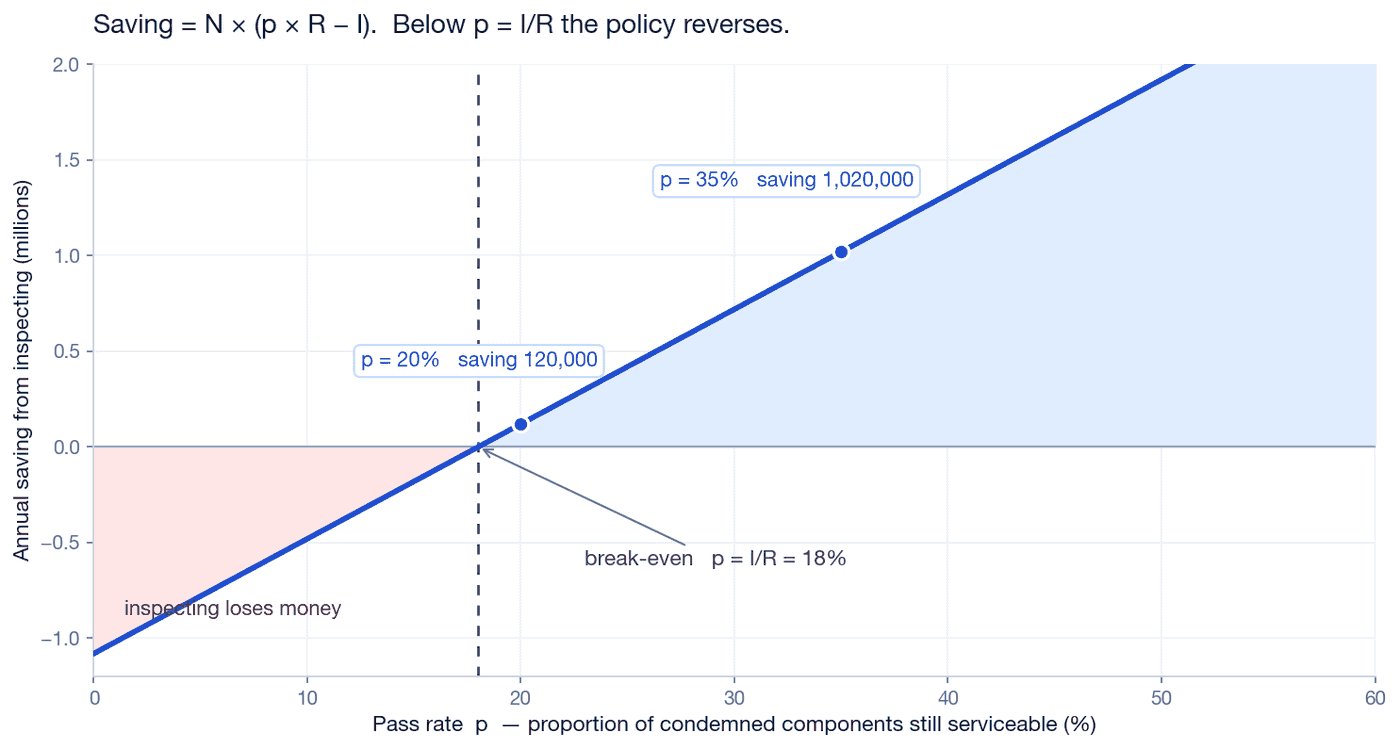
The model plotted for the worked example: N = 600, R = 10,000, I = 1,800. The line crosses zero at p = I/R = 18%. Left of that point, the policy reverses and inspecting costs more than scrapping. The inspection cost behaves the same way in reverse. Double I to 3,600, and the 35 percent scenario stops saving and starts costing: 2,160,000 on inspection plus 3,900,000 on replacements is 6,060,000, or 60,000 worse than simply scrapping everything.
This is the practical reason the calculation is worth doing rather than arguing about. In most organizations, the disagreement is not about the formula. One person assumes the pass rate is 5 percent and another assumes 40 percent, and neither has measured it yet the two assumptions yield opposite answers.
How to Estimate the Inspection Cost (I)
The most common error is using the testing invoice as I. The fully loaded figure includes:
- transport to and from wherever the inspection happens
- labor to clean components before inspection, since contamination hides the defects you are looking for
- equipment or facility time
- storage while components wait
- the inspection cost of components that fail, which is spent and not recovered
That last one catches people out. You pay for inspection on all N components, not just those that pass. That is why Policy B includes N × I rather than applying the inspection cost only to surviving components.
Estimate the Pass Rate (p)
The pass rate cannot be estimated from experience, because the data required to form that experience was destroyed. A scrapped component generates no record of whether scrapping it was correct. So p has to be measured directly, and the measurement is simple. Choose one component category. Stop scrapping it for a defined period. Inspect the accumulated batch properly. Count what passes. That fraction is p.
Two design conditions matter. The people who made the original condemnation decisions should not perform the re-inspection because their desire to prove themselves right could bias the results. Record the outcome regardless of whether it reflects well on the original decisions. Discovering that p is 2% provides useful information rather than indicating a failed experiment.
Which Components to Test First?
The model treats R as the replacement cost, but not all components are equally worth this analysis. The discriminator is the ratio of R that is material to that which is manufacturing. Recycling recovers material. It does not cover machining, heat treatment, threading, certification, or freight, which you must repurchase in full when replacing an item. For plain plate or bar, the material is mostly R, so scrapping loses relatively little. For a precision-machined, heat-treated component, material can be under a third of R, and scrapping destroys the rest.
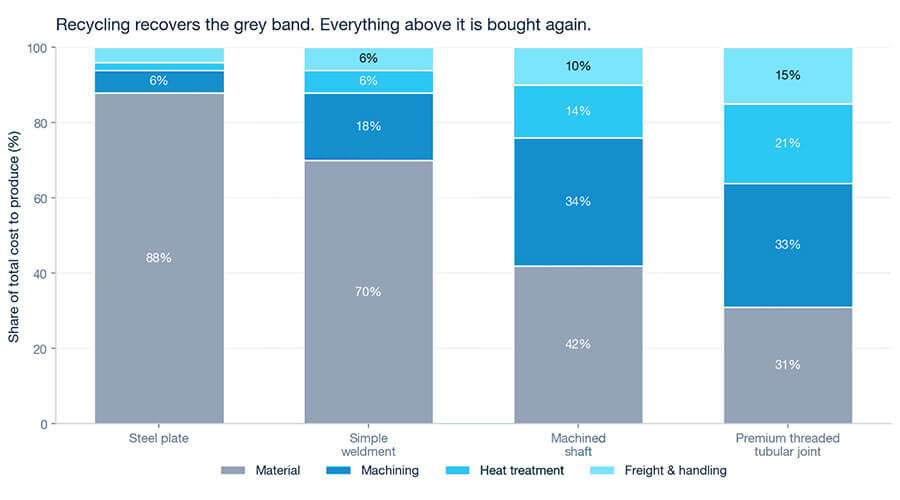
Illustrative cost composition. Recycling recovers only the grey band. For a plate that is most of R; for a precision-threaded component it is under a third, which is what makes R large and the break-even easy to clear. So rank the scrap stream by manufacturing cost as a proportion of total cost, and work down from the top. That ordering also tends to correlate with high R, which improves the break-even independently.
The Measurement Problem at the Interface
One practical complication matters because it determines whether you can measure p reliably. For most high-value components, serviceability depends on the interface, the threads, sealing face, or bearing surface rather than the part’s body. Those surfaces are where wear concentrates and where damage is least visible. A visual check is not a measurement. The industries that have solved this test the interface functionally rather than looking at it.
In threaded assemblies, that means reassembling the connection under controlled conditions and recording torque against rotation throughout. The resulting curve distinguishes cases that a final torque reading cannot: a clean engagement rises smoothly to a sharp shoulder, a contaminated thread produces a step, and a damaged one climbs steadily with no inflection at all, reaching specified torque purely through friction without ever seating.
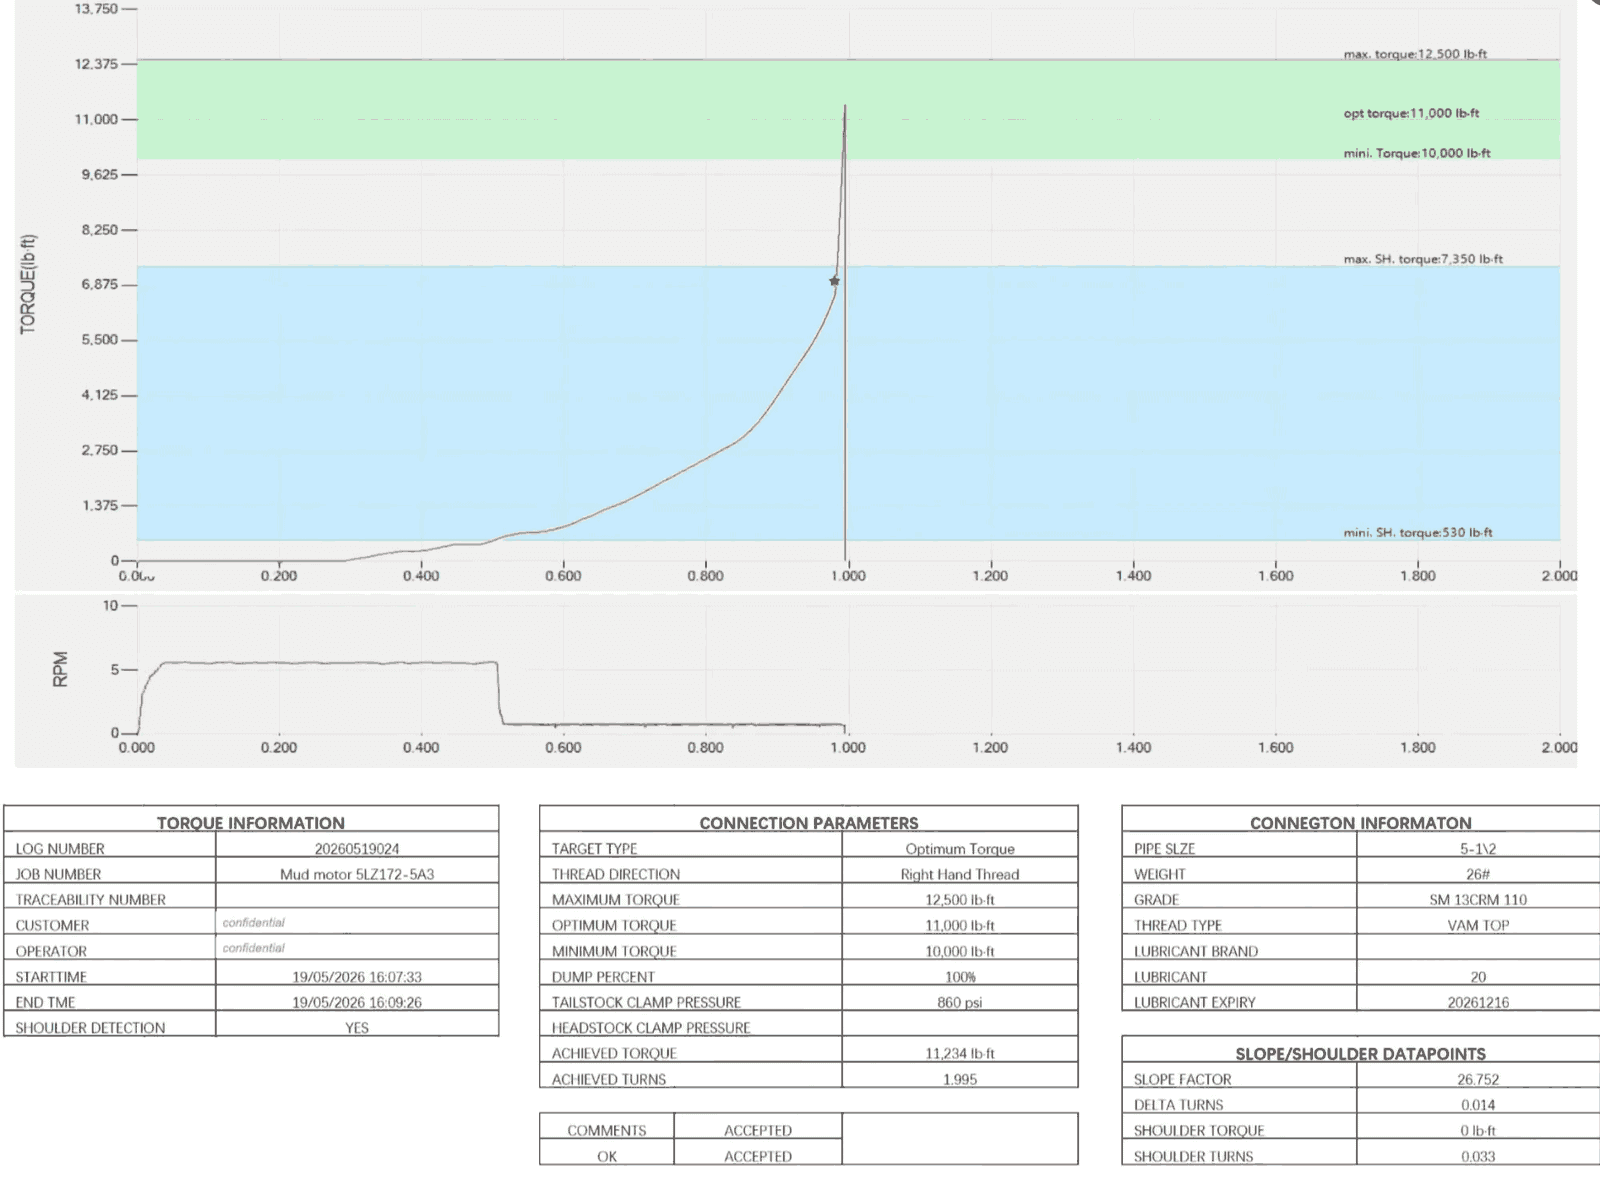
A recorded make-up: a long shallow climb while the threads engage, then a near-vertical rise at the shoulder. This is what converts p from an opinion into a measurement. All three can finish at the same number. The oil and gas sector, where a failed connection is expensive enough to force the issue, uses dedicated horizontal machines that clamp one component, rotate the other, and log the whole curve turning a subjective judgment into a recorded measurement, which is what makes p trustworthy rather than an opinion.
Final Thoughts
The core inspect or replace decision is captured by one condition: I < p × R. Inspect when the loaded inspection cost falls below the pass rate multiplied by the replacement cost. R is already known, and you can estimate I in an afternoon with an honest assessment. Only p requires work, and measuring it costs one deferred scrapping cycle and a day of inspection. For a decision that in many operations governs a seven-figure annual budget, that is an unusually cheap piece of analysis and it is the input almost nobody has.
Recommended Articles
We hope this guide to the inspect or replace decision helps you make more informed maintenance and cost-control choices. Check out these recommended articles for more insights and strategies to improve component management and operational efficiency.